


403
Sorry!!
Error! We're sorry, but the page you were looking for doesn't exist.

A Guide to Multiple Time Frame Analysis
(MENAFN- DailyFX) Multiple time frame analysis follows a top down approach when trading and allows traders to gauge the longer-termtrendwhile spotting ideal entries on a smaller time frame chart. After deciding on the appropriate time frames to analyze, traders can then conduct technical analysis using multiple time frames to confirm or reject theirtrading bias .
Keep reading to learn more:
- What is multiple time frame analysis
- What forex time frames can be applied in multi-time frame analysis
- Multiple time frame analysis techniques for day traders
- Multiple time frame analysis techniques for swing traders
What is multiple time frame analysis?
Multiple time frame analysis, or multi-time frame analysis, is the process of viewing the same currency pair under different time frames. Usually the larger time frame is used to establish a longer-term trend, while a shorter time frame is used to spot ideal entries into the market.
 -p
-p
Considering an example, when viewing the trend on an hourly chart, traders can zoom into the 10-minute chart (1:6) or the 15-minute chart (1:4) for suitable entries. The 10 or 15-minute chart provides an indication of shorter term developments and the hourly chart is where the trade's progress can be monitored going forward.
How to identify the best forex time frame?
Many traders, new and experienced, want to know how to identify thebest time frame to trade forex . In general, traders should select a time frame in accordance with:
- the amount of time available to trade per day
- the most commonly used time frame utilized to identify trade set ups
For example, individuals that scan theforex marketusing daily charts, while only being able to dedicate one hour a day in front of the charts, are better off using the daily time frame for analysis and a four-hour chart for the entry trigger. Those with more time to dedicate to the market, can make use of much smaller time frames as they are able to analyze the market and act quickly when opportunities arise.
Table:General time frames of different traders
| Trader style | Holding period | Trend chart | Entry chart |
| Long-term | 1 day + | Weekly | Daily |
| Swing-trader | Few hours – few days | Daily | 4-hour |
| Short-term | 4-hour | Hourly | |
| Scalper | hourly | 15-minute |
What type of trader are you? Find out in our guide to thedifferent forex trader types .
Multiple time frame analysis techniques for day traders
Day traders typically have the whole day to monitor charts and therefore, can trade with really small time frames. These range anywhere from a one-minute, to the 15-minute, to the one-hour time frame. Day traders that identify their trade set ups on the one-hour time frame can then zoom into the 15-minute time frame to spot ideal market entries.
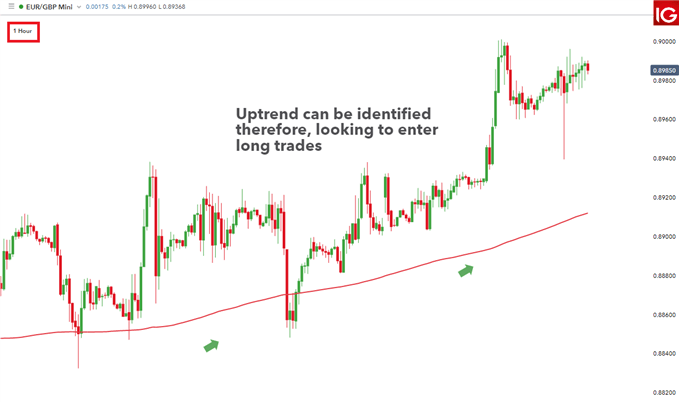
Trend time frame: One-hour chart
Entry time frame: 15-minute chart
Day traders can look at the one-hour chart to establish the trend. Price trades predominantly above the200 MAand is moving upwards, hence the longtrading bias . Day traders can then zoom into the 15-minute chart to spot ideal entries.. Day traders can then zoom into the four-hour chart to spot ideal entries.
EUR/GBPone-hour chart exhibiting an upward bias
 -p
-p
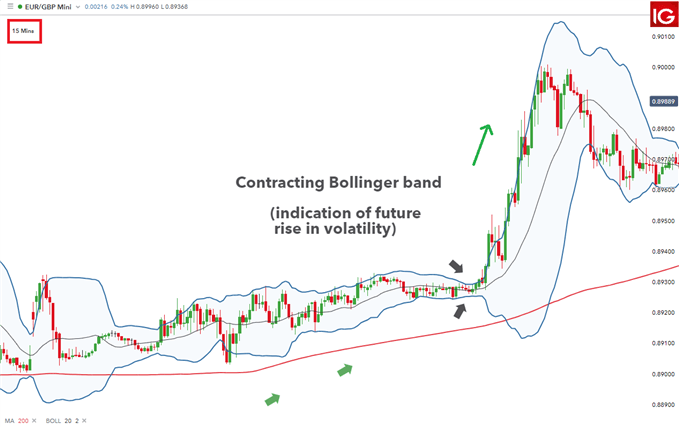
EUR / GBP15-minute chart showing ideal entry into the market
Multiple time frame analysis techniques for swing traders
Swing traders tend to have significantly less time to spend monitoring charts when compared to day traders – perhaps one hour or less. Thus, swing traders will look to the daily chart for the overall trend and then zoom in to the four-hour chart to spot entries.
Trend time frame: Daily chart
Entry time frame: Four-Hour chart
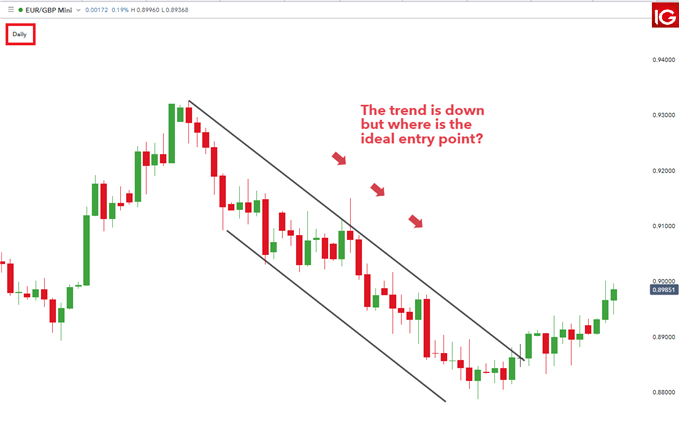
The Daily time frame onEUR/GBPallows traders to spot the downtrend but where is the ideal entry into the market? Zooming into the four-hour time frame sheds more light on this.
EUR / GBPDaily chart exhibiting downward trend
 -p
-p
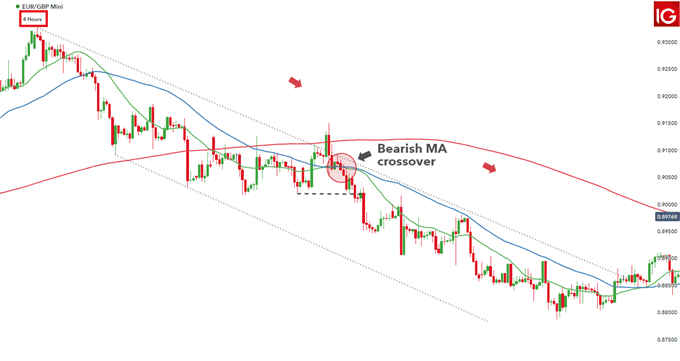
Price is trading below the 200-day SMA and once back within the range there is a bearish crossover as the 20 MA (green line) crosses below the 50 MA (Blue line), providing the entry trigger.
EUR/GBP Four-hour chart filtering trades in favor of short positions
Further reading on time frame analysis
- Get comfortable with changing chart time frames by viewing ourlive charts .
- Multiple time frame analysis can only be utilized once a desired market has been chosen.IG Client Sentimentcan help with this - learnhow to use client sentimentto identify suitable markets.
- Find out whattrading stylematches your trading personality.
- When identifying the long term trend, many traders make use of the200 day simple moving averagebecause of its longstanding reputation of being a good indicator of long term trend.

Legal Disclaimer:
MENAFN provides the
information “as is” without warranty of any kind. We do not accept
any responsibility or liability for the accuracy, content, images,
videos, licenses, completeness, legality, or reliability of the information
contained in this article. If you have any complaints or copyright
issues related to this article, kindly contact the provider above.
Most popular stories
Market Research

More Story


Comments
No comment