403
Sorry!!
Error! We're sorry, but the page you were looking for doesn't exist.
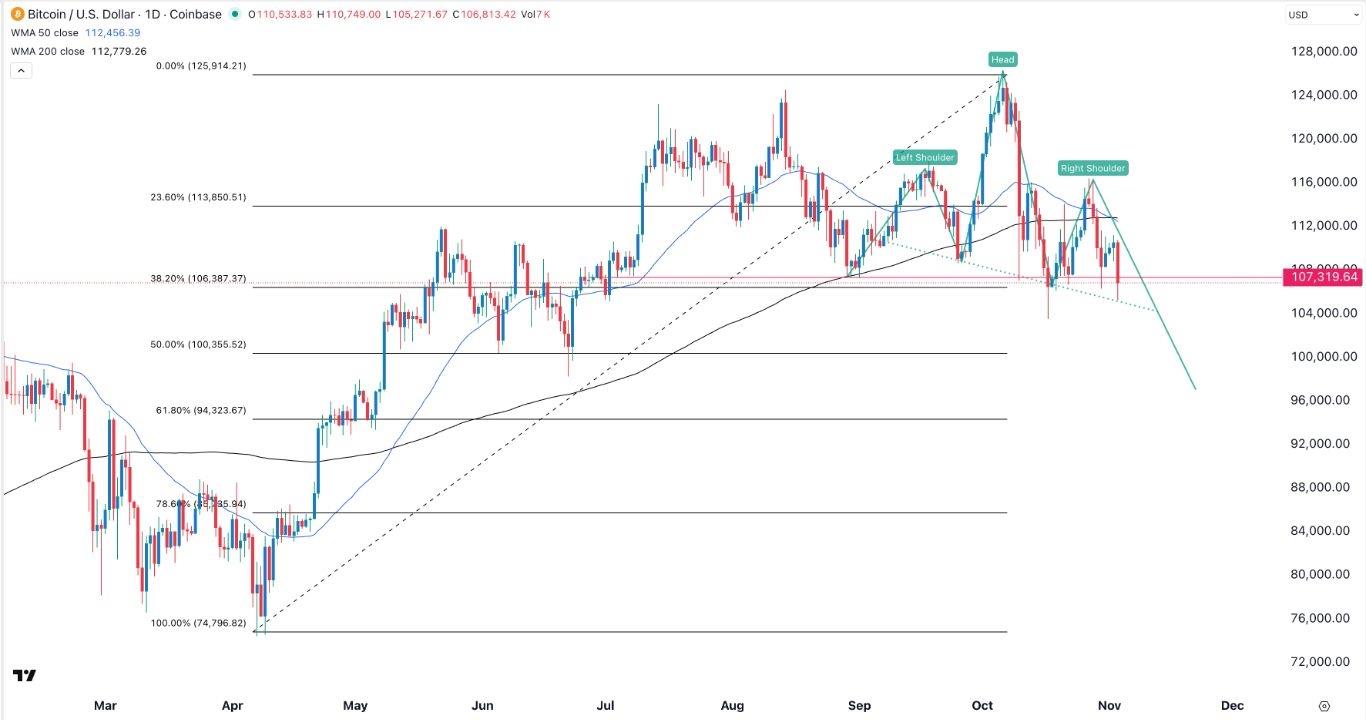
BTC/USD Forex Signal 04/11: Head And Shoulders (Chart)
(MENAFN- Daily Forex) Bearish view
- Sell the BTC/USD pair and set a take-profit at 100,000. Add a stop-loss at 112,000. Timeline: 1-2 days.
- Buy the BTC/USD pair and set a take-profit at 112,000. Add a stop-loss at 100,000.
Signs that the court will oppose Trump's policies will benefit the stock and the crypto market by possibly reducing inflation and pushing the Federal Reserve to continue cutting interest rates.
EURUSD Chart by TradingViewBTC/USD Technical AnalysisThe daily timeframe chart shows that the BTC/USD pair has dropped in the past few weeks, moving from the all-time high of 126,300 to below 106,000.It has settled at the 38.2% Fibonacci Retracement level. Most importantly, it has formed the head-and-shoulders pattern.Bitcoin price formed a death cross pattern as the 50-day and 200-day Exponential Moving Averages crossed each other.Bitcoin has dropped below the Supertrend indicator, while oscillators point to more downside. If this happens, the next key support level to watch will be the 50% Fibonacci Retracement level at 100,355. A move above the shoulder at 116,300 will invalidate the bearish forecast.Ready to trade our daily Forex signals? Here's a list of some of the best crypto brokers to check out.
Legal Disclaimer:
MENAFN provides the
information “as is” without warranty of any kind. We do not accept
any responsibility or liability for the accuracy, content, images,
videos, licenses, completeness, legality, or reliability of the information
contained in this article. If you have any complaints or copyright
issues related to this article, kindly contact the provider above.


Comments
No comment