Tuesday, 02 January 2024 12:17 GMT

AUD/USD Signal 14/10 :Harami Candlestick Pattern Forms


(MENAFN- Daily Forex) Bullish View
  • Buy the AUD/USD pair and set a take-profit at 0.6600.
  • Add a stop-loss at 0.6450.
  • Timeline: 1-2 days.

Bearish View
  • Sell the AUD/USD pair and set a take-profit at 0.6450.
  • Add a stop-loss at 0.6600.

The AUD/USD exchange rate moved sideways and formed the highly bullish harami candlestick pattern as the fears of the US-China trade war faded and as traders waited for a statement from the Fed Chair and RBA Statements

The AUD/USD pair wavered after the RBA published minutes of the last monetary policy meeting. In it, officials decided to leave interest rates unchanged at 3.60%. Officials maintained that inflation remained elevated. Also, the bank emphasized a cautious stance.

The minutes hinted that the bank would decide to slash interest rates in the coming meeting. Such a move will take the benchmark interest rates to 3.35%.

The AUD/USD exchange rate will next react to the upcoming statement by Jerome Powell and other Federal Reserve officials. Powell, the Fed Chair, will deliver his first statement since the US started its government shutdown.

This government shutdown has now entered its third week and economists expect it to have an impact on the economy. For example, Donald Trump has already started firing some workers at a time when the labor market is struggling.

Therefore, the most likely scenario is where Powell hints that the bank will continue cutting rates in the coming meeting. This statement will mirror that of Anna Paulson, the head of the Philadelphia who said that she supported two cuts this year.

In addition to the Fed Chair, other Fed officials who will talk are Christopher Waller, Michele Bowman, and Susan Collins.

AUD/USD Technical Analysis

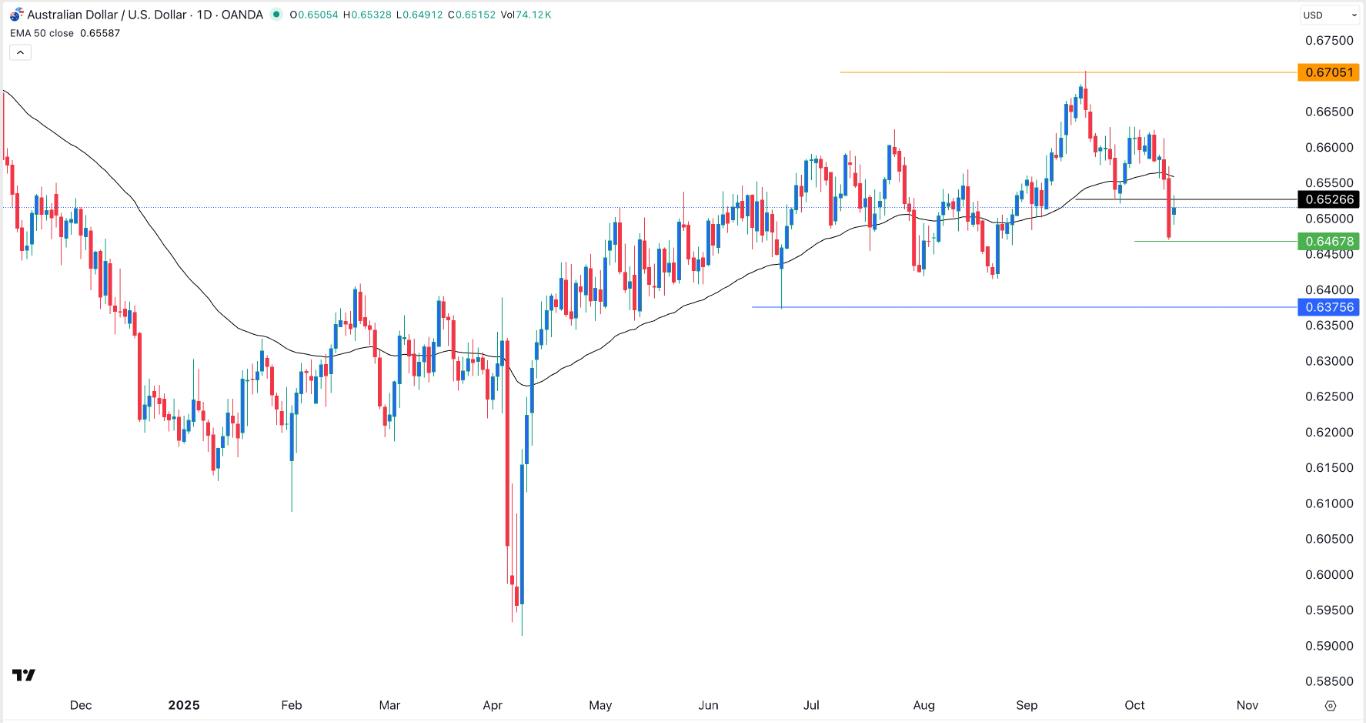
The daily chart shows that the AUD/USD pair plunged to a low of 0.6467 on Friday as tensions between the United States and China. Its Friday's low was the lowest point since August 27.

The pair has remained below the 50-day moving average and 0.6525, its lowest point on September 26. On the positive side, it has formed a harami candlestick pattern. This pattern comprises of a small bullish candle that follows a large bearish candle.

Therefore, the pair will likely bounce back in the coming days. If this happens, it will likely bounce back and hit the important resistance at 0.6600. A move below the support at 0.6467 will invalidate the bullish outlook.

Top Forex Brokers1 Get Started 74% of retail CFD accounts lose money

Ready to trade our free currency signals ? Here are the best Forex brokers to choose from.

MENAFN14102025000131011023ID1110196313


Legal Disclaimer:
MENAFN provides the information “as is” without warranty of any kind. We do not accept any responsibility or liability for the accuracy, content, images, videos, licenses, completeness, legality, or reliability of the information contained in this article. If you have any complaints or copyright issues related to this article, kindly contact the provider above.