403
Sorry!!
Error! We're sorry, but the page you were looking for doesn't exist.
BTC/USD Forex Signal Today 15/04: Bitcoin Pressured (Chart)
(MENAFN- Daily Forex) Bearish view
- Sell the BTC/USD pair and set a take-profit at 80,000. Add a stop-loss at 90,000. Timeline: 1-3 days.
- Buy the BTC/USD pair and set a take-profit at 90,000. Add a stop-loss at 80,000.
Waller's statement mirrored that of Susan Collins, another Fed official, who told the Financial Times that the bank was prepared to cut rates if the economic weakness continued.
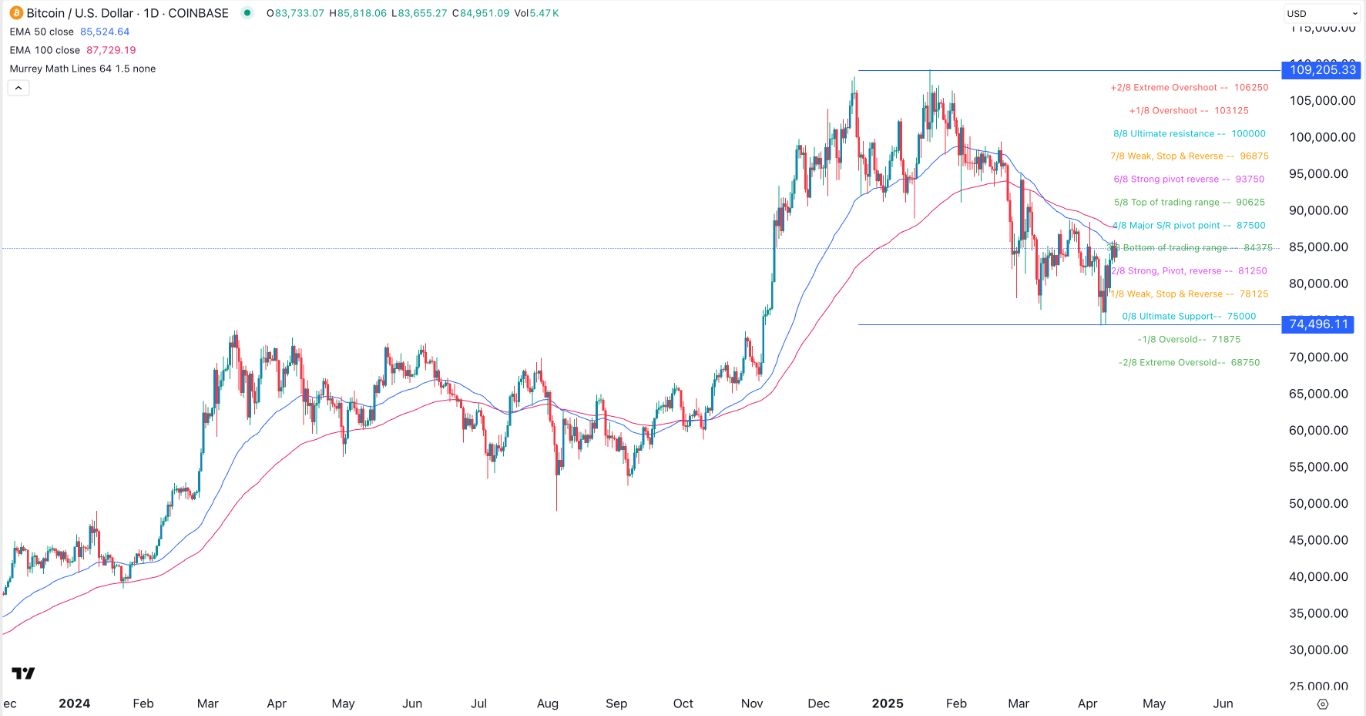
EURUSD Chart by TradingViewBTC/USD technical analysisThe daily chart shows that the BTC/USD pair has been in a strong bearish trend in the past few months. It moved from a high of 109,205 earlier this year to the current 85,000. It has also moved below the 50-day and 100-day moving averages, a sign that bears are in control.The pair remains at the bottom of the trading range of the Murrey Math Lines, a popular tool for identifying support and resistance levels. Therefore, the most likely scenario is where it drops and retests the support at 70,000. A move above the major S/R level at 87,500 will invalidate the bullish view.Ready to trade our free daily Forex trading signals ? We've shortlisted the best MT4 crypto brokers in the industry for you.
Legal Disclaimer:
MENAFN provides the
information “as is” without warranty of any kind. We do not accept
any responsibility or liability for the accuracy, content, images,
videos, licenses, completeness, legality, or reliability of the information
contained in this article. If you have any complaints or copyright
issues related to this article, kindly contact the provider above.


Comments
No comment