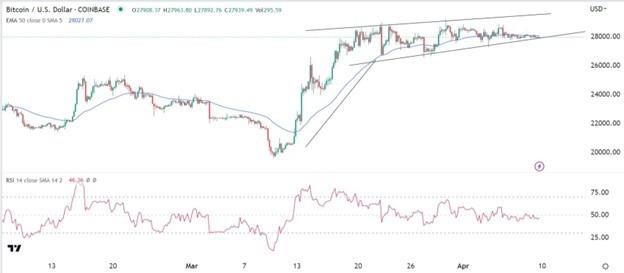
(MENAFN- Daily Forex) Bullish view Buy the BTC/USD pair and set a take-profit at 29,100. Add a stop-loss at 27,000. Timeline: 1-2 days.
Bearish view Set a sell-stop at 27,500 and a take-profit at 26,000. Add a stop-loss at 29,000.
The btc/usd pair has moved sideways in the past few days as traders wait for the next catalyst in the crypto industry. Bitcoin was trading at $28,000 on Monday morning, where it has been in the past few weeks. This price is a few points below the year-to-date high of 29,105. Bitcoin reacted mildly to the latest American jobs report published on Friday. The data revealed that the American economy created more than 236k jobs in March after adding over 300k jobs in the previous months. In all, the economy has added over 1 million jobs this year while the unemployment rate remains at the lowest point in over 50 years. The next key data to watch will be the upcoming American inflation data scheduled on Wednesday. Economists expect the data to show that the headline inflation remained above the Fed's target of 2.0%. They believe that the headline CPI rose by 5.2% on a year-on-year basis while core CPI is expected to come at 5.6%. Inflation and jobs numbers have an impact on Bitcoin prices because of the impacts on the Federal Reserve. These numbers are particularly important because the Fed has hinted that it will be data-dependent. Therefore, if inflation rises, it means that the Fed will be more inclined to hike rates in the coming meeting. The other important catalyst for the BTC/USD will be the upcoming Federal Reserve minutes scheduled for Wednesday. These minutes will provide more information on what Fed officials deliberated on last week and what to expect. Bitcoin also pulled back as the US dollar index continued falling. It was trading at $101, which is much lower than last year's high of $115. American bond yields have also risen slightly after the latest US jobs numbers. Advertisement test out this trade suggestion with a top-rated btc/usd broker get started BTC/USD technical analysisThe 4H chart shows that the BTC/USD pair has been in a downward trend in the past few days. It has settled at the important support, which is the lowest side of the ascending channel. The pair has also moved slightly below the 50-period moving average while the Relative Strength Index (RSI) has moved to the neutral level. Therefore, the pair will likely remain in this range in the next few days. A break below the lower side of the channel will see it drop to the next support at 26,000. The alternative is where the pair drops to the next resistance at 30,000.Ready to trade our free daily forex trading signals ? We've shortlisted the best forex brokers in the industry for you.
MENAFN10042023000131011023ID1105970809
Legal Disclaimer:
MENAFN provides the
information “as is” without warranty of any kind. We do not accept
any responsibility or liability for the accuracy, content, images,
videos, licenses, completeness, legality, or reliability of the information
contained in this article. If you have any complaints or copyright
issues related to this article, kindly contact the provider above.


Comments
No comment