


403
Sorry!!
Error! We're sorry, but the page you were looking for doesn't exist.
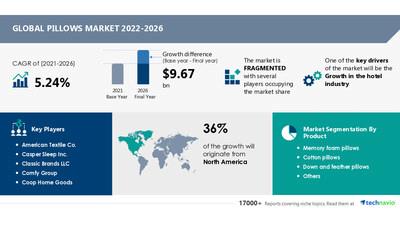
Pillows Market Size To Grow By USD 9.67 Billion | Growth In The Hotel Industry To Boost Market Growth | 17,000+ Technavio Research Reports'
(MENAFN- PR Newswire)
Technavio has announced its latest market research report titled Pillows Market by Product and Geography - Forecast and Analysis 2022-2026
NEW YORK, May 9, 2022 /PRNewswire/ -- The 'Pillows Market by Product (Memory foam pillows, Cotton pillows, Down and feather pillows, and Others) and Geography (North America, Europe, APAC, Middle East and Africa, and South America) - Forecast and Analysis 2022-2026 ' report has been added to Technavio's offering. With ISO 9001:2015 certification, Technavio is proudly partnering with more than 100 Fortune 500 companies for over 16 years.
Technavio has announced its latest market research report titled Pillows Market by Product and Geography - Forecast and Analysis 2022-2026
The potential growth difference for the pillows market between 2021 and 2026 is USD 9.67 billion, as per the latest market analysis report by Technavio. The report also identifies the market to witness an accelerating growth momentum at a CAGR of 5.24% during the forecast period.
To get the exact yearly growth variance and the Y-O-Y growth rate, Talk to our analyst .
Key Market Dynamics:
- Market Driver: The growth in the hotel industry is one of the key drivers contributing to the pillows market growth. The construction of new hotels and the expansion of the hotel industry globally will lead to an increase in demand for bedding essentials, including pillows. The hotel industry in certain European countries has witnessed significant growth in recent years, particularly in the Iberian Peninsula and the UK. In the US, the boom in the hotel industry is attributed to the significant growth in the travel and tourism sector. The US is considered one of the leading countries in the travel and tourism sector worldwide. This is certainly expected to drive the pillows market growth during the forecast period.
- Market Challenge: Health issues related to low-quality pillows is one of the challenges limiting the pillows market growth. Sleeping on the pillows by resting the face on them makes the skin clogged and inflamed and may result in breakouts and acne. Due to the health concerns associated with pillows, many consumers across the globe are avoiding pillows while sleeping, thereby negatively impacting the growth of the global pillows market.
The growth in the hotel industry and increased adoption of memory foam pillows are some of the key market drivers. However, factors such as health issues related to low-quality pillows will challenge market growth.
To learn about additional key drivers, trends, and challenges available with Technavio . Read Sample Report right here!
Revenue-generating Segment Highlights
The pillows market report is segmented by Product (Memory foam pillows, Cotton pillows, Down and feather pillows, and Others) and Geography (North America, Europe, APAC, Middle East and Africa, and South America).
- North America will be the leading region with 36% of the market's growth during the forecast period. The US is the key market for pillows market in North America. Market growth in this region will be slower than the growth of the market in Europe and APAC. The increasing number of vendors in this region and their diversified range of innovative product offerings will facilitate the pillows market growth in North America over the forecast period.
- The pillows market share growth by the memory foam pillows segment will be significant during the forecast period. Memory foam is made of viscoelastic foam, which is polyurethane foam. These pillows automatically adjust according to the pressure exerted upon them by the user and retain their shape in accordance with the pressure exerted, thereby providing users with the right amount of balance and support.
View our sample report for additional insights into the contribution of all the segments, and regional opportunities
Vendor Landscape
The pillows market is fragmented and the vendors are deploying organic and inorganic growth strategies to compete in the market. To make the most of the opportunities and recover from post-pandemic impact, market vendors should focus more on the growth prospects in the fast-growing segments, while maintaining their positions in the slow-growing segments.
Some Companies Mentioned
- American Textile Co.
- Casper Sleep Inc.
- Classic Brands LLC
- Comfy Group
- Coop Home Goods
- CVB Inc.
- Czech Feather and Down Co.
- Five Star Pillow Co.
- Gio Clavis Co. Ltd.
- Headleveler
- Hollander Sleep Products LLC
- Hunan Mendale Hometextile Co. Ltd.
- John Cotton Group Ltd.
- Mediflow Inc.
- Pegasus Home Fashions
- Serta Simmons Bedding LLC
- Talalay Global
- Thrasio LLC
- Throwboy
- Wendre
- To gain access to more vendor profiles with their key offerings available with Technavio, Click Here
Related Reports:
Bedding Market by Distribution Channel and Geography - Forecast and Analysis 2021-2025
Heated Bedding Market by Product, Distribution Channel, and Geography - Forecast and Analysis 2021-2025
Hybrid Mattress Market by Distribution Channel and Geography - Forecast and Analysis 2022-2026
| Pillows Market Scope | |
| Report Coverage | Details |
| Page number | 120 |
| Base year | 2021 |
| Forecast period | 2022-2026 |
| Growth momentum & CAGR | Accelerate at a CAGR of 5.24% |
| Market growth 2022-2026 | $ 9.67 billion |
| Market structure | Fragmented |
| YoY growth (%) | 4.58 |
| Regional analysis | North America, Europe, APAC, Middle East and Africa, and South America |
| Performing market contribution | North America at 36% |
| Key consumer countries | US, China, India, Germany, and UK |
| Competitive landscape | Leading companies, competitive strategies, consumer engagement scope |
| Companies profiled | American Textile Co., Casper Sleep Inc., Classic Brands LLC, Comfy Group, Coop Home Goods, CVB Inc., Czech Feather and Down Co., Five Star Pillow Co., Gio Clavis Co. Ltd., Headleveler, Hollander Sleep Products LLC, Hunan Mendale Hometextile Co. Ltd., John Cotton Group Ltd., Mediflow Inc., Pegasus Home Fashions, Serta Simmons Bedding LLC, Talalay Global, Thrasio LLC, Throwboy, and Wendre |
| Market Dynamics | Parent market analysis, Market growth inducers and obstacles, Fast-growing and slow-growing segment analysis, COVID 19 impact and future consumer dynamics, market condition analysis for forecast period. |
| Customization purview | If our report has not included the data that you are looking for, you can reach out to our analysts and get segments customized. |
Key Topics Covered:
1 Executive Summary
- 1.1 Market overview
- Exhibit 01: Executive Summary – Chart on Market Overview
- Exhibit 02: Executive Summary – Data Table on Market Overview
- Exhibit 03: Executive Summary – Chart on Global Market Characteristics
- Exhibit 04: Executive Summary – Chart on Market by Geography
- Exhibit 05: Executive Summary – Chart on Market Segmentation by Product
- Exhibit 06: Executive Summary – Chart on Incremental Growth
- Exhibit 07: Executive Summary – Data Table on Incremental Growth
- Exhibit 08: Executive Summary – Chart on Vendor Market Positioning
2 Market Landscape
- 2.1 Market ecosystem
- Exhibit 09: Parent market
- Exhibit 10: Market Characteristics
3 Market Sizing
- 3.1 Market definition
- Exhibit 11: Offerings of vendors included in the market definition
- 3.2 Market segment analysis
- Exhibit 12: Market segments
- 3.3 Market size 2021
- 3.4 Market outlook: Forecast for 2021-2026
- Exhibit 13: Chart on Global - Market size and forecast 2021-2026 ($ million)
- Exhibit 14: Data Table on Global - Market size and forecast 2021-2026 ($ million)
- Exhibit 15: Chart on Global Market: Year-over-year growth 2021-2026 (%)
- Exhibit 16: Data Table on Global Market: Year-over-year growth 2021-2026 (%)
4 Five Forces Analysis
- 4.1 Five forces summary
- Exhibit 17: Five forces analysis - Comparison between2021 and 2026
- 4.2 Bargaining power of buyers
- Exhibit 18: Chart on Bargaining power of buyers – Impact of key factors 2021 and 2026
- 4.3 Bargaining power of suppliers
- Exhibit 19: Bargaining power of suppliers – Impact of key factors in 2021 and 2026
- 4.4 Threat of new entrants
- Exhibit 20: Threat of new entrants – Impact of key factors in 2021 and 2026
- 4.5 Threat of substitutes
- Exhibit 21: Threat of substitutes – Impact of key factors in 2021 and 2026
- 4.6 Threat of rivalry
- Exhibit 22: Threat of rivalry – Impact of key factors in 2021 and 2026
- 4.7 Market condition
- Exhibit 23: Chart on Market condition - Five forces 2021 and 2026
5 Market Segmentation by Product
- 5.1 Market segments
- Exhibit 24: Chart on Product - Market share 2021-2026 (%)
- Exhibit 25: Data Table on Product - Market share 2021-2026 (%)
- 5.2 Comparison by Product
- Exhibit 26: Chart on Comparison by Product
- Exhibit 27: Data Table on Comparison by Product
- 5.3 Memory foam pillows - Market size and forecast 2021-2026
- Exhibit 28: Chart on Memory foam pillows - Market size and forecast 2021-2026 ($ million)
- Exhibit 29: Data Table on Memory foam pillows - Market size and forecast 2021-2026 ($ million)
- Exhibit 30: Chart on Memory foam pillows - Year-over-year growth 2021-2026 (%)
- Exhibit 31: Data Table on Memory foam pillows - Year-over-year growth 2021-2026 (%)
- 5.4 Cotton pillows - Market size and forecast 2021-2026
- Exhibit 32: Chart on Cotton pillows - Market size and forecast 2021-2026 ($ million)
- Exhibit 33: Data Table on Cotton pillows - Market size and forecast 2021-2026 ($ million)
- Exhibit 34: Chart on Cotton pillows - Year-over-year growth 2021-2026 (%)
- Exhibit 35: Data Table on Cotton pillows - Year-over-year growth 2021-2026 (%)
- 5.5 Down and feather pillows - Market size and forecast 2021-2026
- Exhibit 36: Chart on Down and feather pillows - Market size and forecast 2021-2026 ($ million)
- Exhibit 37: Data Table on Down and feather pillows - Market size and forecast 2021-2026 ($ million)
- Exhibit 38: Chart on Down and feather pillows - Year-over-year growth 2021-2026 (%)
- Exhibit 39: Data Table on Down and feather pillows - Year-over-year growth 2021-2026 (%)
- 5.6 Others - Market size and forecast 2021-2026
- Exhibit 40: Chart on Others - Market size and forecast 2021-2026 ($ million)
- Exhibit 41: Data Table on Others - Market size and forecast 2021-2026 ($ million)
- Exhibit 42: Chart on Others - Year-over-year growth 2021-2026 (%)
- Exhibit 43: Data Table on Others - Year-over-year growth 2021-2026 (%)
- 5.7 Market opportunity by Product
- Exhibit 44: Market opportunity by Product ($ million)
6 Customer Landscape
- 6.1 Customer landscape overview
- Exhibit 45: Analysis of price sensitivity, lifecycle, customer purchase basket, adoption rates, and purchase criteria
7 Geographic Landscape
- 7.1 Geographic segmentation
- Exhibit 46: Chart on Market share by geography 2021-2026 (%)
- Exhibit 47: Data Table on Market share by geography 2021-2026 (%)
- 7.2 Geographic comparison
- Exhibit 48: Chart on Geographic comparison
- Exhibit 49: Data Table on Geographic comparison
- 7.3 North America - Market size and forecast 2021-2026
- Exhibit 50: Chart on North America - Market size and forecast 2021-2026 ($ million)
- Exhibit 51: Data Table on North America - Market size and forecast 2021-2026 ($ million)
- Exhibit 52: Chart on North America - Year-over-year growth 2021-2026 (%)
- Exhibit 53: Data Table on North America - Year-over-year growth 2021-2026 (%)
- 7.4 Europe - Market size and forecast 2021-2026
- Exhibit 54: Chart on Europe - Market size and forecast 2021-2026 ($ million)
- Exhibit 55: Data Table on Europe - Market size and forecast 2021-2026 ($ million)
- Exhibit 56: Chart on Europe - Year-over-year growth 2021-2026 (%)
- Exhibit 57: Data Table on Europe - Year-over-year growth 2021-2026 (%)
- 7.5 APAC - Market size and forecast 2021-2026
- Exhibit 58: Chart on APAC - Market size and forecast 2021-2026 ($ million)
- Exhibit 59: Data Table on APAC - Market size and forecast 2021-2026 ($ million)
- Exhibit 60: Chart on APAC - Year-over-year growth 2021-2026 (%)
- Exhibit 61: Data Table on APAC - Year-over-year growth 2021-2026 (%)
- 7.6 Middle East and Africa - Market size and forecast 2021-2026
- Exhibit 62: Chart on Middle East and Africa - Market size and forecast 2021-2026 ($ million)
- Exhibit 63: Data Table on Middle East and Africa - Market size and forecast 2021-2026 ($ million)
- Exhibit 64: Chart on Middle East and Africa - Year-over-year growth 2021-2026 (%)
- Exhibit 65: Data Table on Middle East and Africa - Year-over-year growth 2021-2026 (%)
- 7.7 South America - Market size and forecast 2021-2026
- Exhibit 66: Chart on South America - Market size and forecast 2021-2026 ($ million)
- Exhibit 67: Data Table on South America - Market size and forecast 2021-2026 ($ million)
- Exhibit 68: Chart on South America - Year-over-year growth 2021-2026 (%)
- Exhibit 69: Data Table on South America - Year-over-year growth 2021-2026 (%)
- 7.8 US - Market size and forecast 2021-2026
- Exhibit 70: Chart on US - Market size and forecast 2021-2026 ($ million)
- Exhibit 71: Data Table on US - Market size and forecast 2021-2026 ($ million)
- Exhibit 72: Chart on US - Year-over-year growth 2021-2026 (%)
- Exhibit 73: Data Table on US - Year-over-year growth 2021-2026 (%)
- 7.9 China - Market size and forecast 2021-2026
- Exhibit 74: Chart on China - Market size and forecast 2021-2026 ($ million)
- Exhibit 75: Data Table on China - Market size and forecast 2021-2026 ($ million)
- Exhibit 76: Chart on China - Year-over-year growth 2021-2026 (%)
- Exhibit 77: Data Table on China - Year-over-year growth 2021-2026 (%)
- 7.10 Germany - Market size and forecast 2021-2026
- Exhibit 78: Chart on Germany - Market size and forecast 2021-2026 ($ million)
- Exhibit 79: Data Table on Germany - Market size and forecast 2021-2026 ($ million)
- Exhibit 80: Chart on Germany - Year-over-year growth 2021-2026 (%)
- Exhibit 81: Data Table on Germany - Year-over-year growth 2021-2026 (%)
- 7.11 UK - Market size and forecast 2021-2026
- Exhibit 82: Chart on UK - Market size and forecast 2021-2026 ($ million)
- Exhibit 83: Data Table on UK - Market size and forecast 2021-2026 ($ million)
- Exhibit 84: Chart on UK - Year-over-year growth 2021-2026 (%)
- Exhibit 85: Data Table on UK - Year-over-year growth 2021-2026 (%)
- 7.12 India - Market size and forecast 2021-2026
- Exhibit 86: Chart on India - Market size and forecast 2021-2026 ($ million)
- Exhibit 87: Data Table on India - Market size and forecast 2021-2026 ($ million)
- Exhibit 88: Chart on India - Year-over-year growth 2021-2026 (%)
- Exhibit 89: Data Table on India - Year-over-year growth 2021-2026 (%)
- 7.13 Market opportunity by geography
- Exhibit 90: Market opportunity by geography ($ million)
8 Drivers, Challenges, and Trends
- 8.1 Market drivers
- 8.2 Market challenges
- 8.3 Impact of drivers and challenges
- Exhibit 91: Impact of drivers and challenges in 2021 and 2026
- 8.4 Market trends
9 Vendor Landscape
- 9.1 Overview
- 9.2 Vendor landscape
- Exhibit 92: Overview on Criticality of inputs and Factors of differentiation
- 9.3 Landscape disruption
- Exhibit 93: Overview on factors of disruption
- 9.4 Industry risks
- Exhibit 94: Impact of key risks on business
10 Vendor Analysis
- 10.1 Vendors covered
- Exhibit 95: Vendors covered
- 10.2 Market positioning of vendors
- Exhibit 96: Matrix on vendor position and classification
- 10.3 American Textile Co.
- Exhibit 97: American Textile Co. - Overview
- Exhibit 98: American Textile Co. - Product / Service
- Exhibit 99: American Textile Co. - Key offerings
- 10.4 Casper Sleep Inc.
- Exhibit 100: Casper Sleep Inc. - Overview
- Exhibit 101: Casper Sleep Inc. - Product / Service
- Exhibit 102: Casper Sleep Inc. - Key offerings
- 10.5 Comfy Group
- Exhibit 103: Comfy Group - Overview
- Exhibit 104: Comfy Group - Product / Service
- Exhibit 105: Comfy Group - Key offerings
- 10.6 Czech Feather and Down Co.
- Exhibit 106: Czech Feather and Down Co. - Overview
- Exhibit 107: Czech Feather and Down Co. - Product / Service
- Exhibit 108: Czech Feather and Down Co. - Key offerings
- 10.7 Headleveler
- Exhibit 109: Headleveler - Overview
- Exhibit 110: Headleveler - Product / Service
- Exhibit 111: Headleveler - Key offerings
- 10.8 Hollander Sleep Products LLC
- Exhibit 112: Hollander Sleep Products LLC - Overview
- Exhibit 113: Hollander Sleep Products LLC - Product / Service
- Exhibit 114: Hollander Sleep Products LLC - Key offerings
- 10.9 John Cotton Group Ltd.
- Exhibit 115: John Cotton Group Ltd. - Overview
- Exhibit 116: John Cotton Group Ltd. - Product / Service
- Exhibit 117: John Cotton Group Ltd. - Key offerings
- 10.10 Pegasus Home Fashions
- Exhibit 118: Pegasus Home Fashions - Overview
- Exhibit 119: Pegasus Home Fashions - Product / Service
- Exhibit 120: Pegasus Home Fashions - Key offerings
- 10.11 Throwboy
- Exhibit 121: Throwboy - Overview
- Exhibit 122: Throwboy - Product / Service
- Exhibit 123: Throwboy - Key offerings
- 10.12 Wendre
- Exhibit 124: Wendre - Overview
- Exhibit 125: Wendre - Product / Service
- Exhibit 126: Wendre - Key offerings
11 Appendix
- 11.1 Scope of the report
- 11.2 Inclusions and exclusions checklist
- Exhibit 127: Inclusions checklist
- Exhibit 128: Exclusions checklist
- 11.3 Currency conversion rates for US$
- Exhibit 129: Currency conversion rates for US$
- 11.4 Research methodology
- Exhibit 130: Research methodology
- Exhibit 131: Validation techniques employed for market sizing
- Exhibit 132: Information sources
- 11.5 List of abbreviations
- Exhibit 133: List of abbreviations
About Us Technavio is a leading global technology research and advisory company. Their research and analysis focuses on emerging market trends and provides actionable insights to help businesses identify market opportunities and develop effective strategies to optimize their market positions. With over 500 specialized analysts, Technavio's report library Their client base consists of enterprises of all sizes, including more than 100 Fortune 500 companies. This growing client base relies on Technavio's comprehensive coverage, extensive research, and actionable market insights to identify opportunities in existing and potential markets and assess their competitive positions within changing market scenarios.
Contact Technavio ResearchJesse MaidaMedia & Marketing ExecutiveUS: +1 844 364 1100UK: +44 203 893 3200Email:[email protected] Website:
SOURCE Technavio

Legal Disclaimer:
MENAFN provides the
information “as is” without warranty of any kind. We do not accept
any responsibility or liability for the accuracy, content, images,
videos, licenses, completeness, legality, or reliability of the information
contained in this article. If you have any complaints or copyright
issues related to this article, kindly contact the provider above.
Most popular stories
Market Research

More Story


Comments
No comment