


403
Sorry!!
Error! We're sorry, but the page you were looking for doesn't exist.

US-China Trade Deal Optimism Leaves Hong Kong Stocks Behind
(MENAFN- DailyFX) HANG SENG INDEX, HONG KONG PROTESTS, US-CHINA TRADE WAR – Talking Points: 
- US-China trade deal hopes lift Asia Pacific stocks, cool Fed rate cut bets
- Hong Kong market lags amid growing violence as protesters, police clash
- Technical positioning warns the Hang Seng Index uptrend remains intact
Where will markets end 2019? See ourQ4 forecasts for currencies, commodities and stock indexes !
Most Asia Pacific stock indexes have tracked alongside the unwinding of 2020 Fed interest rate cut expectations (red shaded area on the chart below) in recent months. Cautious optimism about the prospects for a resolution of the US-China trade war alongside diminishing worries about a no-deal Brexit have buoyed risk appetite, boosting equities even as it erased certainty in further easing next year.
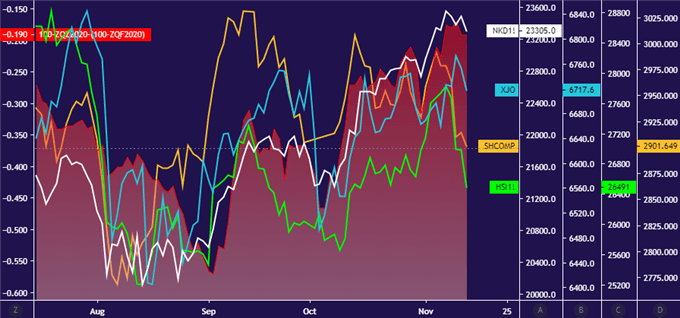
Chart created withTradingView
Shares listed in Hong Kong (green line above) and Shanghai (yellow line) have underperformed however. While Japan'sNikkei 225and Australia'sASX 200(white and turquoise lines, respectively) are trading at or near year-to-date highs, Chinese issues – both mainland and otherwise – are facing potent selling pressure. The Hang Seng Index has been particularly battered, suffering the worst 3-day drop since August.
Increasingly violent clashes between protesters and law enforcement probably account for soggy performance. Demonstrations erupted in June in opposition to proposed law allowing extradition from Hong King to the mainland. The measure has since been withdrawn but activists remain in the streets, demanding full democracy and police accountability.
HONG KONG STOCKS TREND STILL POINTS UPWARD (AT LEAST FOR NOW)Nevertheless, technical positioning warns that the path of least resistance still favors the upside. The Hang Seng Index broke resistance guiding it lower since April at the beginning of this month, signaling a bullish pivot. The recent selloff brought prices back for a retest of this barrier – where rising trend support and a chart inflection zone dating back to June now act as reinforcement – but it has not been breached.
If sellers manage a daily close below 26322, the bullish implications of the current setup will appear to have been neutralized. The next layer of support comes in at 25507, followed by the mid-August low at 24791. Immediate resistance is at 27949, the November 7 swing top. Claiming a foothold above this level would suggest the next leg in the emerging uptrend has begun.
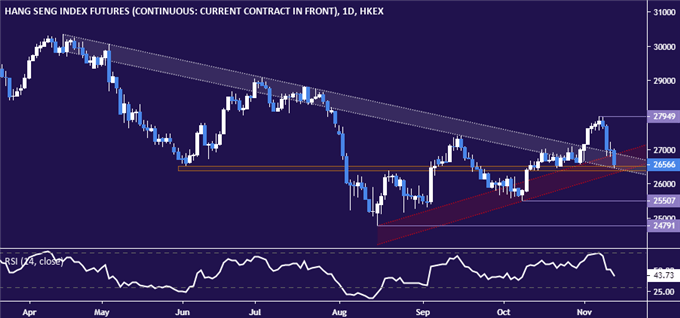
Chart created withTradingView
HANG SENG INDEX TRADING RESOURCES- Just getting started? See ourbeginners' guide for FX traders
- Having trouble with your strategy? Here's the#1 mistake that traders make
- Join a free webinarand have your questions answered
--- Written by Ilya Spivak, Currency Strategist for DailyFX.com
To contact Ilya, use the comments section below or@IlyaSpivakon Twitter
DailyFX

Legal Disclaimer:
MENAFN provides the
information “as is” without warranty of any kind. We do not accept
any responsibility or liability for the accuracy, content, images,
videos, licenses, completeness, legality, or reliability of the information
contained in this article. If you have any complaints or copyright
issues related to this article, kindly contact the provider above.
Most popular stories
Market Research

More Story


Comments
No comment