(MENAFN- ING) Hot jobs data suggests interest rates could stay higher for longer
Friday's US January jobs report was far stronger than what both the market and we had expected and has prompted a major debate on whether this means the economy is more resilient than thought. In turn does this mean interest rates need to stay higher for longer?
It showed a 517,000 increase in non-farm payrolls with substantial upward revisions, including 71,000 to the previous two months while the unemployment rate dropped to a 53-year low at 3.4%. Given the softer activity data and weakening sentiment, economists had expected a mere 188,000 jobs would be added with even the most optimistic forecast of 320,000 being well short. The unemployment rate had been expected to tick higher to 3.6%.
We have been in the camp that thought we would get one more rate rise in March with a slowing economy, weakening jobs market and falling inflation prompting a sharp reversal in the Fed's policy stance from late third quarter
onwards. So does this report mean we need to rip up our forecasts and start again?
Yet inflation pressures continue to subside
It does make the soft landing scenario look more plausible – the idea that inflation will slow to 2% over the next 12 or so months without a recession and significant job losses. After all, inflation will continue to fall given shelter is such a major influence and house prices are dropping everywhere and rents are topping out in all major cities.
There is also evidence that corporate pricing power is weakening while labour costs are moderating as indicated by average hourly earnings numbers within Friday's reports and the Bureau for Economic Analysis' data on personal incomes from wages and salaries. The latest employment cost index was softer than expected with slowing quarterly gains set to push the year-on-year
rate of growth lower through 2023.
YoY change in worker compensation

Macrobond, ING
This all points to a lack of need for major rate hikes from here. But it also raises a very important question. If the labour market is so hot, why are the costs of employing people decelerating and converging back to pre-Covid trends?
Why was the jobs report so strong?
To try to explain it our starting point is to look at
one-off factors that could have boosted the numbers. The most obvious case is the 74,000 jump in government workers led by state and local government education workers. This was due to the ending of strike action by University of California Academics. This merely reverses job losses seen in November and December and means February will experience a return to much lower growth. Nonetheless, there was no single event that could explain the strength in private payrolls, which rose 443,000.
So we now look at the employment surveys that give us a general indication of demand for private sector workers. Job vacancies, which rose to 11mn in December, equivalent to 1.9 job vacancies for every unemployed American, do just that. However, it has been incredibly strong throughout the past two years and that hasn't prevented a slowdown in payrolls growth. Moreover, the ISM employment indices for the manufacturing and services sector are 50.6 and 50.0, respectively, which indicate stagnant employment growth given 50 is the break-even level. They are also at the same level they have averaged over the past six months, so again, no reason for a bounce in hiring.
Then there is the NFIB small business hiring intentions. A net 19% of small businesses were looking to hire workers in January versus 20% for the six-month average so nothing much there. Next we look at the ADP private payrolls, which listed private payrolls as growing by just 106,000. So there is nothing really from the demand side indicators to point to such a strong rise in January payrolls.
No hiring, fewer firings
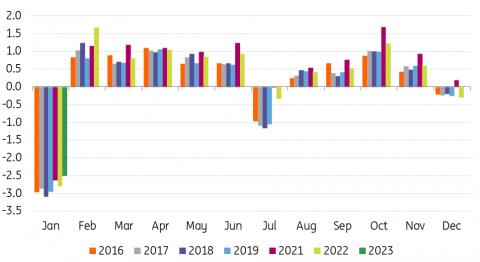
Next we look at the difference between the seasonally adjusted payrolls growth, which is used to observe the cyclical trends – the 517k number that shocked everyone – and the underlying data. The chart below shows the non-seasonally adjusted changes in employment in each month over recent years and it is obvious that January is when a lot of workers lose their jobs due to seasonal factors.
Typically 2.7-3.1mn jobs are shed in January. I've taken out 2020 given the wild swings caused by the pandemic through that year, but even January 2020 saw a 2.8mn drop in employment. This year there were only 2.5mn jobs lost in January – we have to go all the way back to 1995 to find a January that lost fewer jobs.
Non-seasonally adjust payrolls changes (mn)
Macrobond, ING
These seasonal job losses are partly down to the end
of the holiday season with people spending less on retail, leisure and hospitality in January with businesses typically laying off staff at this time. Then there is the weather impacting with winter temperatures and snow limiting the ability of people to work outside – so the like of construction gets hit along with mining and oil and gas drilling. This January was warmer and had less snow than
the average over the past 20 years so construction, mining and drilling has been less disrupted and people have been out and about more, spending money. This suggests that we should also anticipate strong retail sales and industrial production for January. February has been much colder so far.
So essentially the story behind the strength in the payrolls number is fewer people being laid off rather than any meaningful increase in hiring. This view is backed up in the Homebase employment data. Homebase is a labour scheduling and time tracking tool used by tens of thousands of local businesses that are often individually owned and primarily consist of restaurant, retail and personal services – so reflect the experiences of businesses that won't be tracked by the larger survey organisations.
Homebase number of workers versus median for the period Jan 4- Jan 31 2020 (% difference)
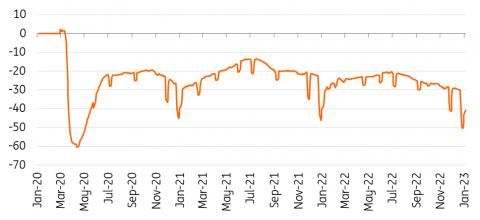
Macrobond, ING
These small businesses have been struggling to hire so there may also be a degree of labour hoarding, fearing that if they lay workers off they may not be able to recruit them when business is better. This is consistent with the decline seen in initial jobless claims yet continuing claims are flat lining – no hiring, fewer firings.
The chart above shows that the January decline in employment was not as significant as in 2021 or 2022. If it isn't hoarding then we should be braced for colder weather in February to mean seasonal lay-offs have simply been delayed from January into February.
Lay-offs are on the rise
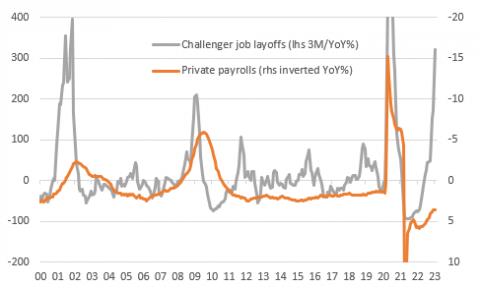
From a job lay-offs announcement perspective the outlook for coming months doesn't look good. Outplacement firm Challenger, Gray & Christmas provides long-term data on lay-offs and hiring announcements by industry and it reported in January that lay-offs rose 440% YoY. The data is volatile, but if we take a 3M average of the annual rate we see that such big increases in lay-offs do typically result in employment growth eventually turning negative – the chart has employment on the right-hand scale inverted so a movement higher implies weakening.
Rising lay-offs point to a deteriorating outlook for employment
Macrobond, ING
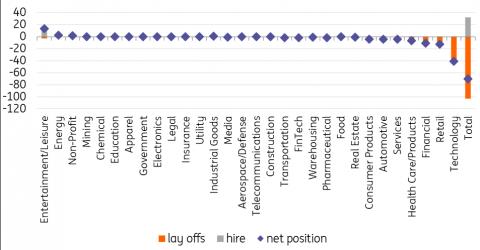
They also track data on hiring announcements so we can get a net figure. In January there were only three sectors out of 30 hiring in net terms; entertainment/leisure, energy and the non-profit sector. The caveat that this reflects larger employers needs to be added, but it doesn't offer much encouragement for continued strength in payrolls.
Challenger lay-offs, hiring and net position in January, by sector (000s)
Macrobond, ING
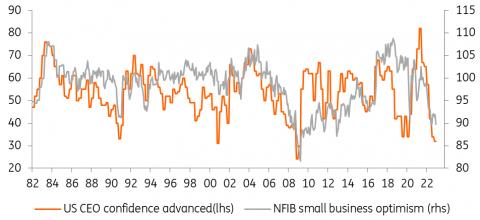
Neither do business surveys in general. Confidence in America's board rooms and the small business sector (Conference board survey of CEOs and the NFIB small business optimism index in the chart below) are below the levels seen at the worst point in the pandemic and are on a par with where we were during the Global Financial Crisis. This would hint at a more defensive mindset that focuses more on cost reduction rather than business expansion. This certainly tallies with the increase in lay-off announcements.
Business optimism is weak
Macrobond, ING
The jobs market is not as strong as January payrolls suggest
As such we appear to have a story where bigger businesses are becoming more cautious and are signaling that demand for workers is flat to falling. Smaller businesses, that struggle to offer the pay and benefits on offer at larger employers are still doing ok and are keen to retain (hoard labour) and hire selectively, but we are a long way from a booming jobs market.
This brings me to my final chart and it paints a remarkable story that full-time employment in America has flatlined since March 2022. All of the jobs created since then have been part-time. This does not paint the picture of a vibrant jobs market.
US full-time and part-time workers (millions)
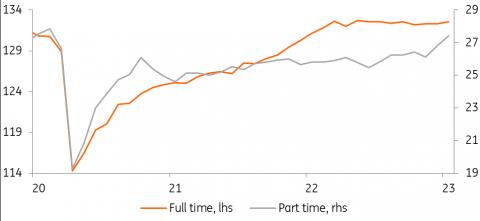
Macrobond, ING
The data suggest we are starting to lose higher paid full-time workers while gaining lower paid part-time workers, which suggests that aggregate household incomes will fall and the economy will continue to gradually soften.
While Friday's jobs report makes a Fed funds peak of 5-5.25% look more plausible in May, it is not guaranteed. Furthermore, while our 100bp of rate cuts from the third quarter
onwards may be too aggressive, we continue to believe that the Fed will be in a position to cut interest rates before the end of the year on the back of decelerating inflation, slower growth and a weaker jobs market.


Comments
No comment