


403
Sorry!!
Error! We're sorry, but the page you were looking for doesn't exist.
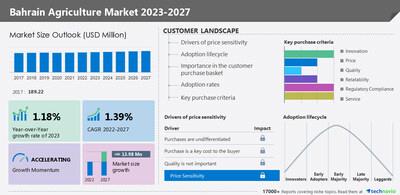
Bahrain Agriculture Market Size To Grow By USD 13.98 Million From 2022 To 2027: Growth Driven By Increasing Government Support - Technavio'
| Agriculture Market In Bahrain Scope | |
| Report Coverage | Details |
| Page number | 109 |
| Base year | 2022 |
| Historic period | 2017-2021 |
| Forecast period | 2023-2027 |
| Growth momentum & CAGR | Accelerate at a CAGR of 1.39% |
| Market growth 2023-2027 | USD 13.98 million |
| Market structure | Fragmented |
| YoY growth | 1.18 |
| Competitive landscape | Leading Vendors, Market Positioning of Vendors, Competitive Strategies, and Industry Risks |
| Key companies profiled | AgroBH, BASF SE, Bayer AG, CNH Industrial NV, Deere and Co., Nutrien Ltd., and Syngenta Crop Protection AG |
| Market dynamics | Parent Market Analysis; Market growth inducers and obstacles; Fast-growing and slow-growing segment analysis for the forecast period |
| Customization purview | If our report has not included the data that you are looking for, you can reach out to our analysts and get segments customized. |
Browse for Technavio 'consumer staples ' Research Reports
Table Of Contents :
1 Executive Summary
- 1.1 Market overview
- Exhibit 01: Executive Summary – Chart on Market Overview Exhibit 02: Executive Summary – Data Table on Market Overview Exhibit 03: Executive Summary – Chart on Country Market Characteristics Exhibit 04: Executive Summary – Chart on Market Segmentation by Type Exhibit 05: Executive Summary – Chart on Market Segmentation by Distribution Channel Exhibit 06: Executive Summary – Chart on Vendor Market Positioning
2 Market Landscape
- 2.1 Market ecosystem
- Exhibit 07: Parent market Exhibit 08: Market Characteristics
3 Market Sizing
- 3.1 Market definition
- Exhibit 09: Offerings of vendors included in the market definition
- 3.2 Market segment analysis
- Exhibit 10: Market segments
- 3.3 Market size 2022
- 3.4 Market outlook: Forecast for 2022-2027
- Exhibit 11: Chart on Bahrain - Market size and forecast 2022-2027 ($ million) Exhibit 12: Data Table on Bahrain - Market size and forecast 2022-2027 ($ million) Exhibit 13: Chart on Bahrain: Year-over-year growth 2022-2027 (%) Exhibit 14: Data Table on Bahrain: Year-over-year growth 2022-2027 (%)
4 Historic Market Size
- 4.1 Agriculture market in Bahrain 2017 - 2021
- Exhibit 15: Historic Market Size – Data Table on Agriculture market in Bahrain 2017 - 2021 ($ million)
- 4.2 Type Segment Analysis 2017 - 2021
- Exhibit 16: Historic Market Size – Type Segment 2017 - 2021 ($ million)
- 4.3 Distributiona channel Segment Analysis 2017 - 2021
- Exhibit 17: Historic Market Size – Distributiona channel Segment 2017 - 2021 ($ million)
5 Five Forces Analysis
- 5.1 Five forces summary
- Exhibit 18: Five forces analysis - Comparison between 2022 and 2027
- 5.2 Bargaining power of buyers
- Exhibit 19: Chart on Bargaining power of buyers – Impact of key factors 2022 and 2027
- 5.3 Bargaining power of suppliers
- Exhibit 20: Bargaining power of suppliers – Impact of key factors in 2022 and 2027
- 5.4 Threat of new entrants
- Exhibit 21: Threat of new entrants – Impact of key factors in 2022 and 2027
- 5.5 Threat of substitutes
- Exhibit 22: Threat of substitutes – Impact of key factors in 2022 and 2027
- 5.6 Threat of rivalry
- Exhibit 23: Threat of rivalry – Impact of key factors in 2022 and 2027
- 5.7 Market condition
- Exhibit 24: Chart on Market condition - Five forces 2022 and 2027
6 Market Segmentation by Type
- 6.1 Market segments
- Exhibit 25: Chart on Type - Market share 2022-2027 (%) Exhibit 26: Data Table on Type - Market share 2022-2027 (%)
- 6.2 Comparison by Type
- Exhibit 27: Chart on Comparison by Type Exhibit 28: Data Table on Comparison by Type
- 6.3 Animal produce - Market size and forecast 2022-2027
- Exhibit 29: Chart on Animal produce - Market size and forecast 2022-2027 ($ million) Exhibit 30: Data Table on Animal produce - Market size and forecast 2022-2027 ($ million) Exhibit 31: Chart on Animal produce - Year-over-year growth 2022-2027 (%) Exhibit 32: Data Table on Animal produce - Year-over-year growth 2022-2027 (%)
- 6.4 Crop produce - Market size and forecast 2022-2027
- Exhibit 33: Chart on Crop produce - Market size and forecast 2022-2027 ($ million) Exhibit 34: Data Table on Crop produce - Market size and forecast 2022-2027 ($ million) Exhibit 35: Chart on Crop produce - Year-over-year growth 2022-2027 (%) Exhibit 36: Data Table on Crop produce - Year-over-year growth 2022-2027 (%)
- 6.5 Rural activities - Market size and forecast 2022-2027
- Exhibit 37: Chart on Rural activities - Market size and forecast 2022-2027 ($ million) Exhibit 38: Data Table on Rural activities - Market size and forecast 2022-2027 ($ million) Exhibit 39: Chart on Rural activities - Year-over-year growth 2022-2027 (%) Exhibit 40: Data Table on Rural activities - Year-over-year growth 2022-2027 (%)
- 6.6 Market opportunity by Type
- Exhibit 41: Market opportunity by Type ($ million)
7 Market Segmentation by Distribution Channel
- 7.1 Market segments
- Exhibit 42: Chart on Distribution Channel - Market share 2022-2027 (%) Exhibit 43: Data Table on Distribution Channel - Market share 2022-2027 (%)
- 7.2 Comparison by Distribution Channel
- Exhibit 44: Chart on Comparison by Distribution Channel Exhibit 45: Data Table on Comparison by Distribution Channel
- 7.3 Supermarket - Market size and forecast 2022-2027
- Exhibit 46: Chart on Supermarket - Market size and forecast 2022-2027 ($ million) Exhibit 47: Data Table on Supermarket - Market size and forecast 2022-2027 ($ million) Exhibit 48: Chart on Supermarket - Year-over-year growth 2022-2027 (%) Exhibit 49: Data Table on Supermarket - Year-over-year growth 2022-2027 (%)
- 7.4 Convenience stores - Market size and forecast 2022-2027
- Exhibit 50: Chart on Convenience stores - Market size and forecast 2022-2027 ($ million) Exhibit 51: Data Table on Convenience stores - Market size and forecast 2022-2027 ($ million) Exhibit 52: Chart on Convenience stores - Year-over-year growth 2022-2027 (%) Exhibit 53: Data Table on Convenience stores - Year-over-year growth 2022-2027 (%)
- 7.5 E-commerce - Market size and forecast 2022-2027
- Exhibit 54: Chart on E-commerce - Market size and forecast 2022-2027 ($ million) Exhibit 55: Data Table on E-commerce - Market size and forecast 2022-2027 ($ million) Exhibit 56: Chart on E-commerce - Year-over-year growth 2022-2027 (%) Exhibit 57: Data Table on E-commerce - Year-over-year growth 2022-2027 (%)
- 7.6 Market opportunity by Distribution Channel
- Exhibit 58: Market opportunity by Distribution Channel ($ million)
8 Customer Landscape
- 8.1 Customer landscape overview
- Exhibit 59: Analysis of price sensitivity, lifecycle, customer purchase basket, adoption rates, and purchase criteria
9 Drivers, Challenges, and Trends
- 9.1 Market drivers
- 9.2 Market challenges
- 9.3 Impact of drivers and challenges
- Exhibit 60: Impact of drivers and challenges in 2022 and 2027
- 9.4 Market trends
10 Vendor Landscape
- 10.1 Overview
- 10.2 Vendor landscape
- Exhibit 61: Overview on Criticality of inputs and Factors of differentiation
- 10.3 Landscape disruption
- Exhibit 62: Overview on factors of disruption
- 10.4 Industry risks
- Exhibit 63: Impact of key risks on business
11 Vendor Analysis
- 11.1 Vendors covered
- Exhibit 64: Vendors covered
- 11.2 Market positioning of vendors
- Exhibit 65: Matrix on vendor position and classification
- 11.3 AgroBH
- Exhibit 66: AgroBH - Overview Exhibit 67: AgroBH - Product / Service Exhibit 68: AgroBH - Key offerings
- 11.4 BASF SE
- Exhibit 69: BASF SE - Overview Exhibit 70: BASF SE - Business segments Exhibit 71: BASF SE - Key news Exhibit 72: BASF SE - Key offerings Exhibit 73: BASF SE - Segment focus
- 11.5 Bayer AG
- Exhibit 74: Bayer AG - Overview Exhibit 75: Bayer AG - Business segments Exhibit 76: Bayer AG - Key news Exhibit 77: Bayer AG - Key offerings Exhibit 78: Bayer AG - Segment focus
- 11.6 CNH Industrial NV
- Exhibit 79: CNH Industrial NV - Overview Exhibit 80: CNH Industrial NV - Business segments Exhibit 81: CNH Industrial NV - Key news Exhibit 82: CNH Industrial NV - Key offerings Exhibit 83: CNH Industrial NV - Segment focus
- 11.7 Deere and Co.
- Exhibit 84: Deere and Co. - Overview Exhibit 85: Deere and Co. - Business segments Exhibit 86: Deere and Co. - Key news Exhibit 87: Deere and Co. - Key offerings Exhibit 88: Deere and Co. - Segment focus
- 11.8 Nutrien Ltd.
- Exhibit 89: Nutrien Ltd. - Overview Exhibit 90: Nutrien Ltd. - Business segments Exhibit 91: Nutrien Ltd. - Key news Exhibit 92: Nutrien Ltd. - Key offerings Exhibit 93: Nutrien Ltd. - Segment focus
- 11.9 Syngenta Crop Protection AG
- Exhibit 94: Syngenta Crop Protection AG - Overview Exhibit 95: Syngenta Crop Protection AG - Business segments Exhibit 96: Syngenta Crop Protection AG - Key offerings Exhibit 97: Syngenta Crop Protection AG - Segment focus
12 Appendix
- 12.1 Scope of the report
- 12.2 Inclusions and exclusions checklist
- Exhibit 98: Inclusions checklist Exhibit 99: Exclusions checklist
- 12.3 Currency conversion rates for US$
- Exhibit 100: Currency conversion rates for US$
- 12.4 Research methodology
- Exhibit 101: Research methodology Exhibit 102: Validation techniques employed for market sizing Exhibit 103: Information sources
- 12.5 List of abbreviations
- Exhibit 104: List of abbreviations
About Us
Technavio is a leading global technology research and advisory company. Their research and analysis focus on emerging market trends and provides actionable insights to help businesses identify market opportunities and develop effective strategies to optimize their market positions. With over 500 specialized analysts, Technavio's report library consists of more than 17,000 reports, covering 800 technologies spanning 50 countries. Their client base consists of enterprises of all sizes, including more than 100 Fortune 500 companies. This growing client base relies on Technavio's comprehensive coverage, extensive research, and actionable market insights to identify opportunities in existing and potential markets and assess their competitive positions within changing market scenarios.
Contact
Technavio Research
Jesse Maida
Media & Marketing Executive
US: +1 844 364 1100
UK: +44 203 893 3200
Email: [email protected]
Website:
SOURCE Technavio

Legal Disclaimer:
MENAFN provides the
information “as is” without warranty of any kind. We do not accept
any responsibility or liability for the accuracy, content, images,
videos, licenses, completeness, legality, or reliability of the information
contained in this article. If you have any complaints or copyright
issues related to this article, kindly contact the provider above.
Most popular stories
Market Research

More Story


Comments
No comment