USD/JPY Rate Approaches Yearly High Ahead Of US PCE Report
Talking Points
approaches the yearly high (145.90) amid the ongoing rise in US Treasury yields, and fresh data prints coming out of the US may prop up the exchange rate as the Personal Consumption Expenditure (PCE) Price Index is expected to show sticky inflation.
Advertisement/JPY Rate Approaches Yearly High Ahead of US PCE Report
USD/JPY extends the rebound from last week's low (140.35) even as for the first time since 1998, and efforts by the government to shore up the Japanese Yen may continue to have a limited impact on the exchange rate as the Federal Reserve pursues a restrictive policy.
As a result, the update to the core US PCE, the Fed's preferred gauge for inflation, may fuel the recent advance in USD/JPY as the reading is expected to increase to 4.7% in August from 4.6% per annum the month prior, and evidence of persistent price growth may force the (FOMC) to retain its approach in combating inflation as the show a steeper path for US interest rates.
In turn, the may continue to outperform against its Japanese counterpart as the remains reluctant to winddown its easing cycle, while the tilt in retail sentiment looks poised to persist as traders have been net-short USD/JPY for most of 2022.
The shows only 24.32% of traders are currently net-long USD/JPY, with the ratio of traders short to long standing at 3.11 to 1.
The number of traders net-long is 1.28% lower than yesterday and 18.44% lower from last week, while the number of traders net-short is 5.34% higher than yesterday and 0.26% lower from last week. The decline in net-long position comes as USD/JPY approaches the yearly high (145.90), while the drop in net-short interest has done little to alleviate the crowding behavior as 28.21% of traders were net-long the pair last week.
With that said, an uptick in the core US PCE may generate a bullish reaction in USD/JPY as it fuels speculation for another 75bp Fed rate hike, but the Relative Strength Index (RSI) appears to be deviating with price as the recent advance in the exchange rate fails to push the oscillator into oversold territory.
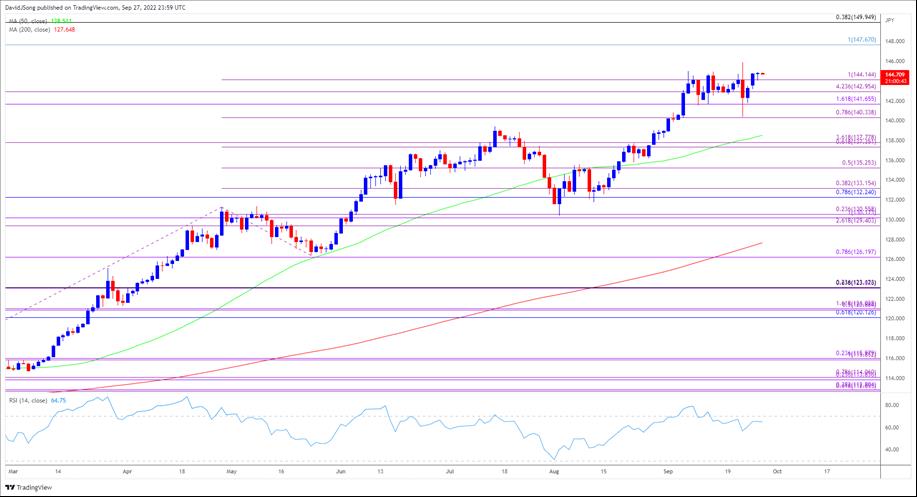
USD/JPY Rate Daily Chart
Source:
- USD/JPY appears to be on track to test the yearly high (145.90) as it climbs back above the 144.10 (100% expansion) region, with the next area of interest coming in around the August 1998 high (147.67) as the exchange rate appears to be tracking the positive slope in the 50-Day SMA (138.51).
- However, the appears to be diverging with price as it struggles to climb into overbought territory, and USD/JPY may track the monthly range as long as the oscillator holds below 70.
- Failure to hold above the 144.10 (100% expansion) region may push USD/JPY back towards the 143.00 (4.236% expansion) handle, with a break/close 141.70 (161.8% expansion) bringing the 140.30 (78.6% expansion) area back on the radar, which largely lines up with last week's low (140.35).
--- Written by David Song, Currency Strategist
Follow me on Twitter at @DavidJSong

Legal Disclaimer:
MENAFN provides the
information “as is” without warranty of any kind. We do not accept
any responsibility or liability for the accuracy, content, images,
videos, licenses, completeness, legality, or reliability of the information
contained in this article. If you have any complaints or copyright
issues related to this article, kindly contact the provider above.


Comments
No comment