ASX 200 Technical Analysis: Long Uptrend Could Be Losing Steam
ASX 200 Technical Analysis Talking Points:
The ASX 200 remains within its dominant uptrend However, it looks tired and may need to pause Where this process takes it could be key Get live, interactive coverage of all major Australian economic data at the DailyFX Webinars
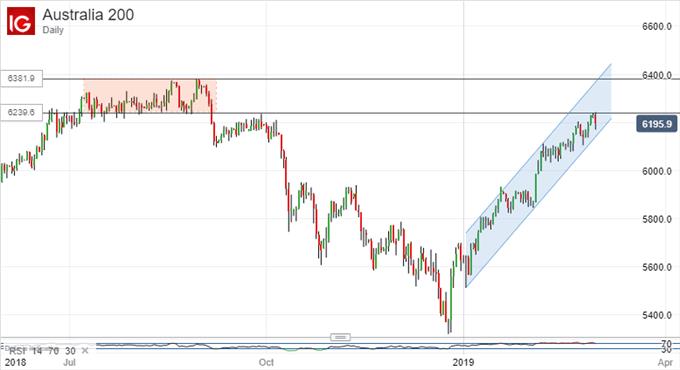
The ASX 200 is right in the center of a respected uptrend channel from January's lows which has not taken it very close to a key resistance zone.On its daily char the Sydney stock benchmark is sitting just below a band between 6239 and 6381 which last held trading sway between July and September of 2018.
The top of that band represents a high which had not previously been seen for very nearly ten years. Of course, we know that the selloff which followed that high last year took the index all the way down to the lows of January. That being so there will inevitably be questions about the ASX's ability to survive long in such a rarified atmosphere should it get back up there. After all, it has not ever done so for very long.But a more pressing question might be whether or not the index can convincingly break into that resistance zone. It shows some tentative signs of exhaustion and a failure to push on beyond its most recent intraday highs (around 6239) on a daily or weekly closing basis might make those signs more obvious.
Of course, the uptrend is still very much with us and any pauses in the near-term could be no more than some needed consolidation. The index looks rather overbought, unsurprisingly, so some time to cool down may be no bad thing for the bulls.Still, a closer look at the daily chart might suggest scope for the formation of a ‘head and shoulders' pattern, with the shoulder coming in around 6200.
This would be quite a serious ‘topping out' sign, with a break below the current uptrend line perhaps the first clear signal that this could indeed be what we are dealing with. As evidence either way is likely to come fairly soon the uncommitted might want to wait and see at this point.Its also worth noting that, while the index has regained the uptrend from February 2016 on its longer term monthly chart, it is in danger of making a lower high there this month, unless it can top those ten-year peaks.
None of this is conclusive proof that we are at any sort of turning point, and a surge in global risk appetite could well put the fundamental bull train back on the rails in some style. But there are a few points of technical concern here that do bear watching.Resources for Traders Whether you're new to trading or an old hand DailyFX has plenty of resources to help you. There's our trading sentiment indicator which shows you live how IG clients are positioned right now. We also hold educational and analytical webinars and offer trading guides, with one specifically aimed at those new to foreign exchange markets . There's also a Bitcoin guide . Be sure to make the most of them all. They were written by our seasoned trading experts and they're all free.
--- Written by David Cottle, DailyFX Research
Follow David on Twitter @DavidCottleFX or use the Comments section below to get in touch!

Legal Disclaimer:
MENAFN provides the
information “as is” without warranty of any kind. We do not accept
any responsibility or liability for the accuracy, content, images,
videos, licenses, completeness, legality, or reliability of the information
contained in this article. If you have any complaints or copyright
issues related to this article, kindly contact the provider above.


Comments
No comment