Gold Prices May Rise on US Jobs Data, Crude Oil at a Crossroads
may rise as the falls despite upbeat jobs data weighing up backwardation, signs of risk aversion See here what say about coming price moves Gold prices advanced as the , boosting the appeal of anti-fiat assets epitomized by the yellow metal. The move appeared to reflect precautionary de-risking ahead of the upcoming release of January's US jobs report.
While an improvement is expected, it may be read as bolstering a recently dominant narrative that sees robust global growth as a catalyst for top central banks to follow the Fed's hawkish lead. That threatens to eat into the greenback's yield advantage, and offering gold a further boost.Crude oil prices marched higher for a second day, this time without the benefit of clearly supportive fundamental news flow or an upturn in overall market sentiment. In fact, the lull in headline risk may have been a catalyst onto itself as investors took stock of deepening oil market backwardation.
Put simply, this means that the price to buy oil now is higher than in the future, implying that near-term demand is outstripping supply. That disparity widened yesterday, which might have inspired bargain hunters to buy the dip after prices hit a one-week low on Wednesday.From here, the data docket is not much more eventful. Baker Hughes rig count data and speculative positioning numbers form the ICE and the CFTC are due, but rarely market-moving. That might argue for gains, but upside momentum may be capped if the risk-off cues on display in futures aren't overturned.
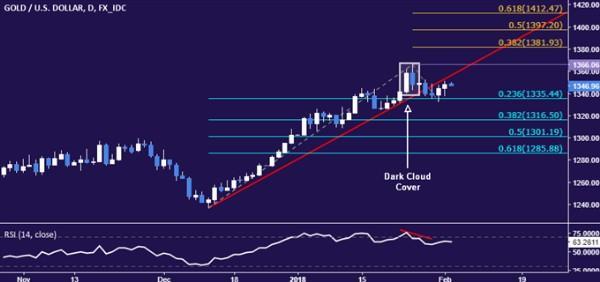
See our free guide to learn what are the !GOLD TECHNICAL ANALYSIS Gold prices edged cautiously higher but the outlines of a remain in place. Near-term support is at 1335.44, the 23.6% Fibonacci retracement, with a daily close below that targeting the 38.2% level at 1316.50. Alternatively, a push above trend line support-turned-resistance, now at 1356.40, opens the door for a retest of the January 25 high at 1366.06.
Chart created using TradingViewCRUDE OIL TECHNICAL ANALYSIS Crude oil prices rebounded, putting the January 25 high at 66.63 back in the crosshairs. A daily close above this barrier exposes the 38.2% Fibonacci expansion at 67.65. Alternatively, a move back below the January 31 low at 63.64 targets the 38.2% Fib retracement at 62.62.
Chart created using TradingView
--- Written by Ilya Spivak, Currency Strategist for DailyFX.com
To receive Ilya's analysis directly via email, pleaseContact and follow Ilya on Twitter:

Legal Disclaimer:
MENAFN provides the
information “as is” without warranty of any kind. We do not accept
any responsibility or liability for the accuracy, content, images,
videos, licenses, completeness, legality, or reliability of the information
contained in this article. If you have any complaints or copyright
issues related to this article, kindly contact the provider above.


Comments
No comment