(MENAFN- Daily Forex) Short Trade IdeaEnter your short position between $176.49 (an intermediate horizontal support level) and $184.00 (yesterday's intra-day high).Top Regulated Brokers1 Get Started 74% of retail CFD accounts lose money Market Index Analysis Molina Healthcare (NYSE:MOH) is a member of the S&P 500 Index. This index trades near its 2026 highs, while non-AI headlines suggest caution ahead. The Bull Bear Power Indicator for the S&P 500 Index is bullish with a negative divergence.
Market Sentiment AnalysisEquity futures are retreating this morning from all-time highs amid elevated oil prices, weighing on the AI frenzy. Iran walked away from negotiations, and while oil prices spiked, the news was met with relative calm, though enough to fuel inflation. Alphabet announced plans to raise $80 billion for its AI buildout, while HPE rallied amid record AI data center expansion. Markets will get the May JOLTS report today, while earnings from Palo Alto Networks, Dollar General, Ulta Beauty, and Victoria's Secret highlight the earnings calendar Healthcare Fundamental AnalysisMolina Healthcare is a managed care company. It focuses on health insurance coverage for lower-income households through government programs, Medicaid, and Medicare, why am I bearish on MOH at current levels?I turned bearish on Molina Healthcare after it breached my take-profit level on my bullish call from two months ago, as it announced its 2026 full-year earnings-per-share guidance of at least $5.00, below consensus estimates of $13.76. It also struggles with Medicaid margin compression, and last quarter's revenue miss adds to medium-term concerns. It will take a further revenue hit from exiting the Medicare Advantage Part D program next year. I am equally bearish on margin wars with peers such as UnitedHealth and Elevance Health, which could erode profitability.
| Metric | Value | Verdict |
| P/E Ratio | 49.00 | Bearish |
| P/B Ratio | 2.34 | Bearish |
| PEG Ratio | 1.71 | Bearish |
| Current Ratio | 1.63 | Bearish |
| ROIC-WACC Ratio | Positive | Bullish The price-to-earnings (P/E) ratio of 49.00 makes MOH an expensive stock. By comparison, the P/E ratio for the S&P 500 Index is 32.76.The average analyst price target for MOH is $186.62. This suggests negligible upside potential with rising downside risks Healthcare Technical AnalysisToday's MOH Signal
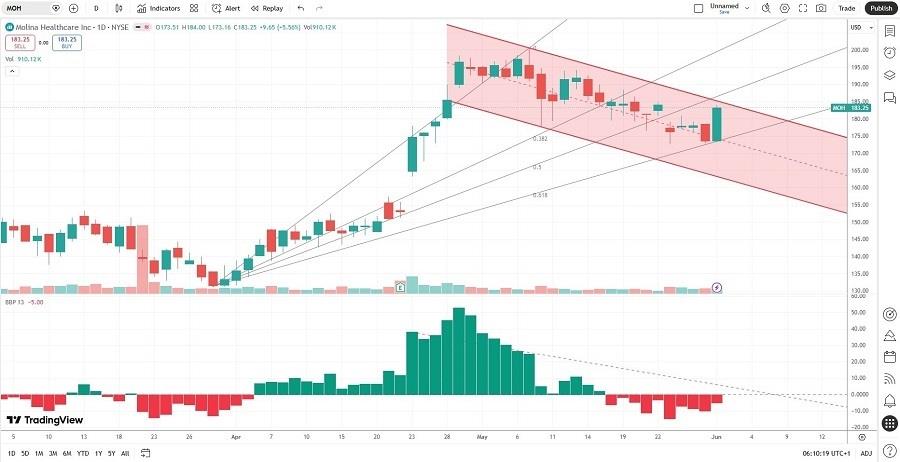
The MOH D1 chart shows price action inside a bearish price channel. It also shows price action between its ascending 50.0% and 61.8% Fibonacci Retracement Fan levels. The Bull Bear Power Indicator is bearish and below its descending trendline. The average bearish trading volumes are higher than the average bullish trading volumes. MOH corrected as the S&P 500 Index advanced, a significant bearish confirmation. My MOH Short Stock Trade MOH Entry Level: Between $176.49 and $184.00 MOH Take Profit: Between $131.20 and $138.66 MOH Stop Loss: Between $192.59 and $200.55 Risk/Reward Ratio: 2.81 Ready to trade our analysis of Molina Healthcare? Here is our list of the best stockbrokers worth checking out. |
MENAFN03062026000131011023ID1111204420
Legal Disclaimer:
MENAFN provides the
information “as is” without warranty of any kind. We do not accept
any responsibility or liability for the accuracy, content, images,
videos, licenses, completeness, legality, or reliability of the information
contained in this article. If you have any complaints or copyright
issues related to this article, kindly contact the provider above.


Comments
No comment