


403
Sorry!!
Error! We're sorry, but the page you were looking for doesn't exist.
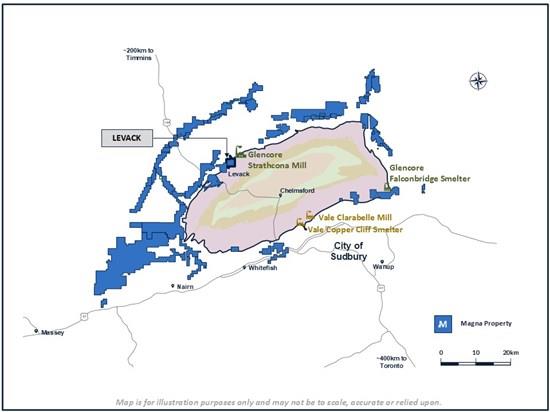
Magna Mining Reports Mineral Resource Estimate For The Levack Mine In Sudbury, Ontario
| Deposit Type | Category | Cut-off Grade | Short Tons | Metric Tonnes | Cu % | Ni % | Co % | Pt (g/tonne) | Pd (g/tonne) | Au (g/tonne) | Ag (g/tonne) | CuEq % |
| Contact | Indicated | 2.00% CuEq | 6,535,000 | 5,928,000 | 0.89 | 1.41 | 0.05 | 0.46 | 0.56 | 0.07 | 0.99 | 3.18 |
| Footwall | Indicated | 2.50% CuEq | 197,000 | 178,000 | 9.06 | 2.37 | 0.02 | 3.60 | 6.58 | 1.56 | 34.15 | 15.52 |
| Total | Indicated | 6,732,000 | 6,106,000 | 1.13 | 1.44 | 0.04 | 0.56 | 0.74 | 0.11 | 1.95 | 3.54 |
Table 2: Levack Mineral Resource Estimate 1 - Inferred Category, August 31, 2025
| Deposit Type | Category | Cut-off Grade | Short Tons | Metric Tonnes | Cu % | Ni % | Co % | Pt (g/tonne) | Pd (g/tonne) | Au (g/tonne) | Ag (g/tonne) | CuEq % |
| Contact | Inferred | 2.00% CuEq | 5,288,000 | 4,797,000 | 0.87 | 1.46 | 0.04 | 0.39 | 0.40 | 0.05 | 0.68 | 3.15 |
| Footwall | Inferred | 2.50% CuEq | 406,000 | 368,000 | 5.42 | 0.75 | 0.01 | 2.91 | 5.40 | 1.53 | 21.00 | 9.35 |
| Total | Inferred | 5,694,000 | 5,165,000 | 1.19 | 1.41 | 0.04 | 0.57 | 0.76 | 0.16 | 2.13 | 3.59 |
Table 3: Levack Mineral Resource Estimate 1 - Footwall Zones, August 31, 2025
| Deposit Type | Zone | Category | Cut-off Grade | Short Tons | Metric Tonnes | Cu % | Ni % | Co % | Pt (g/tonne) | Pd (g/tonne) | Au (g/tonne) | Ag (g/tonne) | CuEq % |
| Footwall | Keel | Indicated | 2.50% CuEq | - | - | ||||||||
| Footwall | Morrison | Indicated | 2.50% CuEq | 197,000 | 178,000 | 9.06 | 2.37 | 0.02 | 3.60 | 6.58 | 1.56 | 34.15 | 15.52 |
| Footwall | No.3 FW | Indicated | 2.50% CuEq | - | - | ||||||||
| Total | Indicated | 2.50% CuEq | 197,000 | 178,000 | 9.06 | 2.37 | 0.02 | 3.60 | 6.58 | 1.56 | 34.15 | 15.52 | |
| Footwall | Keel | Inferred | 2.50% CuEq | 229,000 | 208,000 | 4.36 | 0.48 | 0.01 | 1.41 | 1.88 | 1.10 | 17.74 | 6.44 |
| Footwall | Morrison | Inferred | 2.50% CuEq | 93,000 | 85,000 | 8.83 | 1.47 | 0.01 | 2.16 | 4.87 | 1.20 | 20.67 | 12.88 |
| Footwall | No.3 FW | Inferred | 2.50% CuEq | 83,000 | 76,000 | 4.49 | 0.68 | 0.01 | 7.86 | 15.66 | 3.08 | 30.32 | 13.36 |
| Total | Inferred | 2.50% CuEq | 406,000 | 368,000 | 5.42 | 0.75 | 0.01 | 2.91 | 5.40 | 1.53 | 21.00 | 9.35 |
Table 4: Levack Mineral Resource Estimate 1 , Sensitivity to Cut-off Grade, August 31, 2025
| Cut-off Grade | Type | Category | Short Tons | Metric Tonnes | Cu % | Ni % | Co % | Pt (g/tonne) | Pd (g/tonne) | Au (g/tonne) | Ag (g/tonne) | CuEq % |
| 1.50% CuEq | Contact | Indicated | 9,767,000 | 8,861,000 | 0.75 | 1.20 | 0.04 | 0.40 | 0.49 | 0.06 | 0.88 | 2.70 |
| 1.75% CuEq | Contact | Indicated | 7,951,000 | 7,213,000 | 0.82 | 1.31 | 0.04 | 0.43 | 0.53 | 0.06 | 0.93 | 2.95 |
| 2.00% CuEq | Contact | Indicated | 6,535,000 | 5,928,000 | 0.89 | 1.41 | 0.05 | 0.46 | 0.56 | 0.07 | 0.99 | 3.18 |
| 2.25% CuEq | Contact | Indicated | 5,348,000 | 4,852,000 | 0.97 | 1.52 | 0.05 | 0.49 | 0.60 | 0.07 | 1.04 | 3.42 |
| 2.50% CuEq | Contact | Indicated | 4,350,000 | 3,946,000 | 1.04 | 1.62 | 0.05 | 0.52 | 0.63 | 0.08 | 1.10 | 3.66 |
| 2.00% CuEq | Footwall | Indicated | 200,000 | 181,000 | 8.94 | 2.34 | 0.02 | 3.55 | 6.48 | 1.53 | 33.74 | 15.30 |
| 2.25% CuEq | Footwall | Indicated | 198,000 | 180,000 | 9.00 | 2.35 | 0.02 | 3.57 | 6.53 | 1.55 | 33.94 | 15.40 |
| 2.50% CuEq | Footwall | Indicated | 197,000 | 178,000 | 9.06 | 2.37 | 0.02 | 3.60 | 6.58 | 1.56 | 34.15 | 15.52 |
| 2.75% CuEq | Footwall | Indicated | 195,000 | 177,000 | 9.13 | 2.38 | 0.02 | 3.63 | 6.63 | 1.57 | 34.37 | 15.63 |
| 3.00% CuEq | Footwall | Indicated | 193,000 | 175,000 | 9.21 | 2.40 | 0.02 | 3.66 | 6.69 | 1.58 | 34.60 | 15.76 |
| Cut-off Grade | Type | Category | Short Tons | Metric Tonnes | Cu % | Ni % | Co % | Pt (g/tonne) | Pd (g/tonne) | Au (g/tonne) | Ag (g/tonne) | CuEq % |
| 1.50% CuEq | Contact | Inferred | 7,625,000 | 6,917,000 | 0.75 | 1.25 | 0.04 | 0.34 | 0.35 | 0.05 | 0.70 | 2.72 |
| 1.75% CuEq | Contact | Inferred | 6,384,000 | 5,791,000 | 0.82 | 1.35 | 0.04 | 0.36 | 0.38 | 0.05 | 0.70 | 2.93 |
| 2.00% CuEq | Contact | Inferred | 5,288,000 | 4,797,000 | 0.87 | 1.46 | 0.04 | 0.39 | 0.40 | 0.05 | 0.68 | 3.15 |
| 2.25% CuEq | Contact | Inferred | 4,378,000 | 3,971,000 | 0.93 | 1.56 | 0.05 | 0.42 | 0.43 | 0.06 | 0.70 | 3.36 |
| 2.50% CuEq | Contact | Inferred | 3,498,000 | 3,173,000 | 1.01 | 1.66 | 0.05 | 0.46 | 0.47 | 0.06 | 0.75 | 3.61 |
| 2.00% CuEq | Footwall | Inferred | 448,000 | 406,000 | 5.01 | 0.69 | 0.01 | 2.75 | 5.02 | 1.42 | 19.84 | 8.68 |
| 2.25% CuEq | Footwall | Inferred | 425,000 | 386,000 | 5.23 | 0.72 | 0.01 | 2.83 | 5.22 | 1.48 | 20.45 | 9.03 |
| 2.50% CuEq | Footwall | Inferred | 406,000 | 368,000 | 5.42 | 0.75 | 0.01 | 2.91 | 5.40 | 1.53 | 21.00 | 9.35 |
| 2.75% CuEq | Footwall | Inferred | 387,000 | 352,000 | 5.60 | 0.77 | 0.01 | 3.00 | 5.60 | 1.58 | 21.58 | 9.67 |
| 3.00% CuEq | Footwall | Inferred | 364,000 | 330,000 | 5.86 | 0.80 | 0.01 | 3.13 | 5.86 | 1.65 | 22.39 | 10.10 |
1 Footnotes to the Levack Mineral Resource Estimate
The effective date of the Levack Mine Mineral Resource Estimate (MRE) is August 31, 2025. This is the close out date for the final mineral resource models and mine out models (as-builts) The mineral resources are reported at a cut-off grade of 2.00% CuEq for Contact deposits and 2.50% CuEq for Footwall deposits. Values in this table reported above and below the cut-off grades should not be misconstrued with a Mineral Resource Statement. The values are only presented to show the sensitivity of the block model estimates to the selection of cut-off grade. CuEq is calculated using metal prices of $4.50/lb Cu, $7.31/lb Ni, $15.00/lb Co, $1,291/oz Pt, $1,031/oz Pd,$3,324/oz Au, and $37.40/oz Ag. Metal recoveries considered are 91% for Cu, 85% for Ni, 68% for Co, 64% for Pt, 69.5% for Pd, 70.5% for Au, and 70% for Ag The mineral resource was estimated by Jonathan Cirelli, P.Geo. of Orix Geoscience Inc. and is an independent Qualified Person as defined by NI 43-101. A site visit was conducted on July 9th, 2025. The classification of the current Mineral Resource Estimate (MRE) into Indicated and Inferred mineral resources is consistent with current 2014 CIM Definition Standards - For Mineral Resources and Mineral Reserves. All figures are rounded to reflect the relative accuracy of the estimate and numbers may not add due to rounding. The mineral resources are presented undiluted and in situ, constrained by diamond drillhole information and previous underground geological mapping, and are considered to have reasonable prospects for eventual economic extraction. The mineral resource is exclusive of mined out material. The drillhole database includes data from 10,525 surface and underground diamond drill holes completed between 1911 and 2025. The drilling totals 4,382,756 ft (1,335,864 m) including 341,394 assay intervals representing 1,393,512 ft (424,742 m) of data. Mineral resources which are not mineral reserves do not have demonstrated economic viability. An Inferred Mineral Resource has a lower level of confidence than that applying to an Indicated Mineral Resource and must not be converted to a Mineral Reserve. It is reasonably expected that most Inferred Mineral Resources could be upgraded to Indicated Mineral Resources with continued exploration. Grades for Ni, Cu, Co, Pt, Pd, Au, and Ag are estimated for each mineralization domain using ~2.0 ft (0.61 m), 2.5 ft (0.76 m), or 5.0 ft (1.52 m) composites assigned to that domain, depending on the style of mineralization. To generate grade within the blocks, the inverse distance squared (ID2) interpolation method was used for all domains. Samples were capped before compositing when required. Reliable density measurements were available for 21% of the samples in the drillhole database (71,712 measured samples) allowing for zone-specific Ni and Cu-based regression formulas to be created and applied to estimate missing densities. 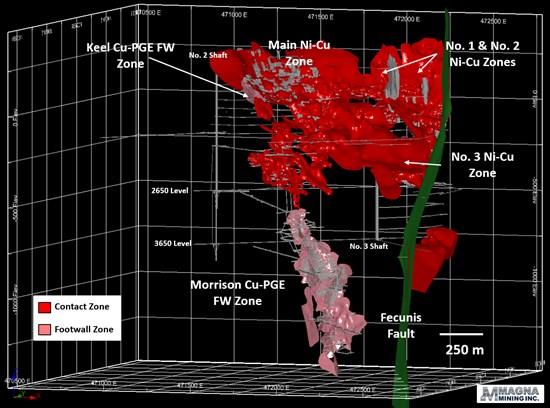
Figure 2: Levack Mine Underground Development and Mineralized Zones. Oblique 3D View Looking Northwest.
To view an enhanced version of this graphic, please visit:
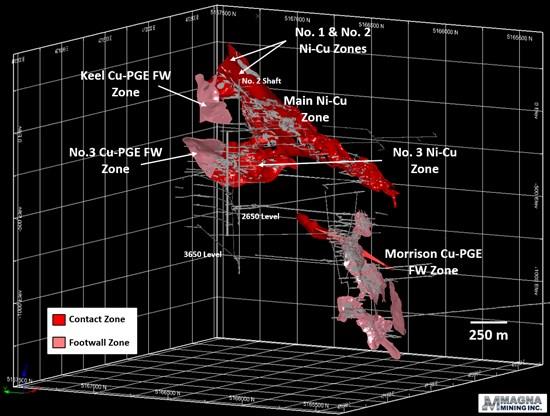
Figure 3: Levack Mine Underground Development and Mineralized Zones. Oblique 3D View Looking Southeast.
To view an enhanced version of this graphic, please visit:
The technical report in support of the above noted mineral resource estimates will be filed by Magna within 45 days of this press release.
Announcement of Filing of Q3 Financials and Conference Call
The Company is scheduled to release its Q3 2025 financial results and MD&A after the market close on Tuesday November 25, 2025. In addition, the Company will be holding a conference call and webcast on Wednesday November 26, 2025 at 8:00am EST.
To register for the conference call, please use the following link to obtain a Dial-in Number and PIN:
To attend the webcast in listen-only mode, please use the following link:
Qualified Person for Technical Information
The scientific and technical information in this press release has been reviewed and approved by both Jonathan Cirelli, P.Geo, Senior Geologist of Orix Geoscience Inc., independent of the Company, and David King, M.Sc., P.Geo, Senior Vice President, Exploration and Geoscience for the Company. Both Mr. Cirelli and Mr. King are qualified persons under National Instrument 43-101.
Cautionary Statement on Forward-Looking Statements
All statements, other than statements of historical fact, contained or incorporated by reference in this press release constitute "forward-looking statements" and "forward-looking information" (collectively, "forward-looking statements") within the meaning of applicable securities laws. Generally, these forward-looking statements can be identified by the use of forward-looking terminology, such as "may", "might", "potential", "expect", "anticipate", "estimate", "believe", "could", "should", "would", "will", "continue", "intend", "plan", "forecast", "prospective", "significant" or other similar words or phrases or variations thereof. Forward-looking statements are necessarily based upon a number of assumptions that, while considered reasonable by management, are inherently subject to business, market, economic, technical and other risks, uncertainties and contingencies that may cause actual results, performance or achievements to be materially different from those expressed or implied by forward-looking statements, including risks and uncertainties relating to the failure of additional drilling to support assumptions, expectations or estimates of potential mineralization, metal tonnes or grade, such as those related to the Morrison Deposit, the failure of additional drilling to support additional expansion or delineation of estimated resources, the failure of additional drilling to support production planning, the lack of availability of drill rigs to implement exploration or other programs or the failure to proceed as quickly as planned with additional exploration or other drilling, continued delays for assay results, the failure to proceed as quickly as planned with or to complete additional development as anticipated, such as the development of a ramp from the surface of, or recommissioning of the hoisting plant at, the Levack Mine, the failure to proceed as quickly as planned with a restart of mining at the Levack Mine, assuming there will be any restart, and other risks disclosed in the Company's annual management discussion and analysis, available on the SEDAR+ website (at: ). Although the Company has attempted to identify important risks, uncertainties, contingencies and factors that could cause actual results to differ materially from those expressed or implied in forward-looking statements, there can be no certainty or assurance that the Company has accurately or adequately captured, accounted for or disclosed all such risks, uncertainties, contingencies or factors. Readers should place no reliance on forward-looking statements as actual results, performance or achievements may be materially different from those expressed or implied by such statements. Resource exploration and development, and mining operations, are highly speculative, characterized by several significant risks, which even a combination of careful evaluation, experience and knowledge will not eliminate. Forward-looking statements speak only as of the date they are made. The Company does not undertake to update any forward-looking statements, whether as a result of new information or future events or otherwise, except in accordance with applicable securities laws.
Neither the TSX Venture Exchange nor its Regulation Services Provider (as that term is defined in the policies of the TSX Venture Exchange) accept responsibility for the adequacy or accuracy of this press release.
About Magna Mining Inc.
Magna Mining Inc. is a producing mining company with a strong portfolio of copper, nickel, and platinum group metals (PGM) assets located in the world-class Sudbury mining district of Ontario, Canada. The Company's primary asset is the McCreedy West Mine, currently in production, supported by a pipeline of highly prospective past-producing properties including Levack, Crean Hill, Podolsky, and Shakespeare.
Magna Mining is strategically positioned to unlock long-term shareholder value through continued production, exploration upside, and near-term development opportunities across its asset base.
Additional corporate and project information is available at and through the Company's public filings on the SEDAR+ website at .
For further information, please contact:
Jason Jessup
Chief Executive Officer
or
Paul Fowler, CFA
Executive Vice President
705-482-9667
Email: ...
![]()
To view the source version of this press release, please visit
SOURCE: Magna Mining Inc.

Legal Disclaimer:
MENAFN provides the
information “as is” without warranty of any kind. We do not accept
any responsibility or liability for the accuracy, content, images,
videos, licenses, completeness, legality, or reliability of the information
contained in this article. If you have any complaints or copyright
issues related to this article, kindly contact the provider above.
Most popular stories
Market Research

More Story


Comments
No comment