Tuesday, 02 January 2024 12:17 GMT

AUD/USD Forex Signal 15/10: Hammer Candle (Chart)


(MENAFN- Daily Forex) Bullish view
  • Buy the AUD/USD pair and set a take-profit at 0.6600.
  • Add a stop-loss at 0.6440.
  • Timeline: 1-2 days.
Bearish view
  • Sell the AUD/USD pair and set a take-profit at 0.6440.
  • Add a stop-loss at 0.6600.

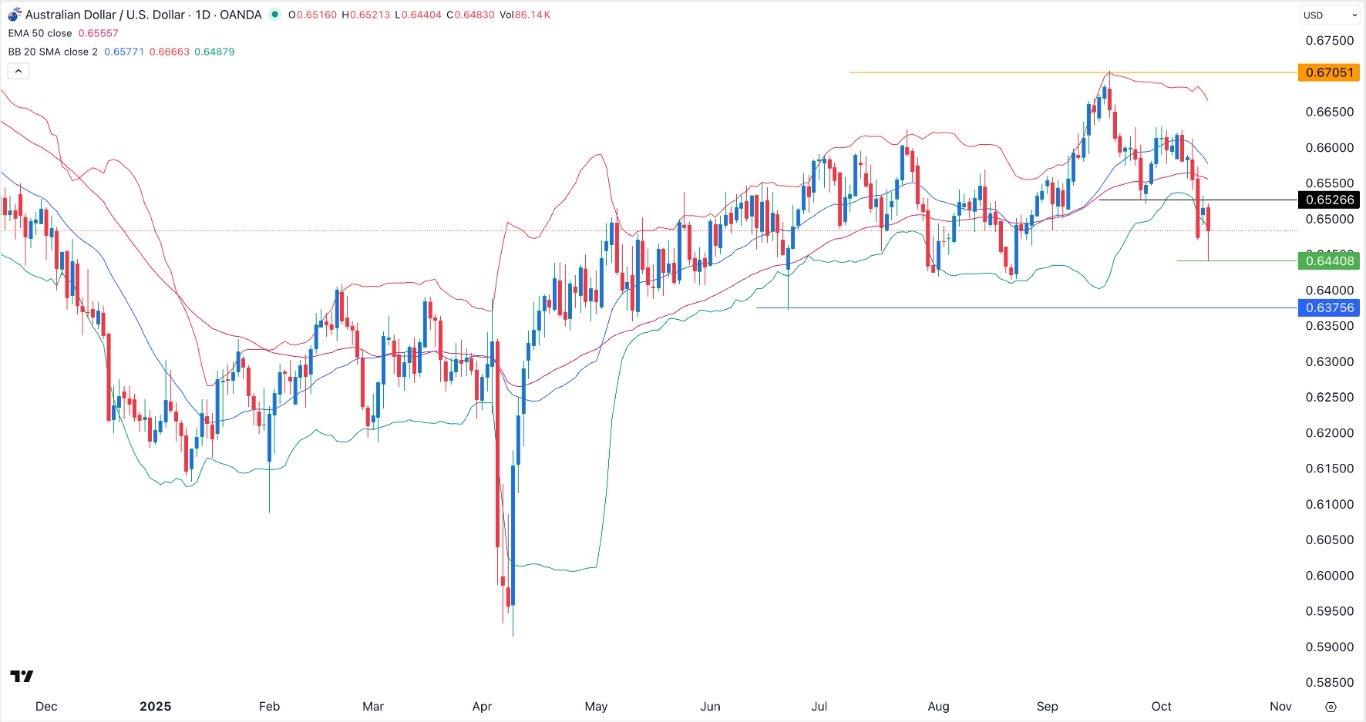
The AUD/USD exchange rate dropped and then bounced back, forming a hammer candlestick pattern after the Reserve Bank of Australia (RBA) published its minutes and after the dovish statement by Jerome Powell, the Federal Reserve Chair. It dropped to a multi-month low of 0.6438, down by almost 4% from its highest level in September Reserve and RBA Divergence

The AUD/USD exchange rate dropped after the RBA published minutes of the last meeting in which officials decided to leave interest rates unchanged at 3.6%.

RBA officials noted that they were committed to data dependence when determining when to cut interest rates. They also pointed to recent data, which showed that the labor market was strong and that inflation was nearing its 2% target, while the unemployment rate was at a historical low of 4%.

The next key AUD/USD news will come on Thursday when the Australian Bureau of Statistics (ABS) will publish the latest jobs numbers, with economists predicting that the unemployment rate rose slightly in September.

Top Forex Brokers1 Get Started 74% of retail CFD accounts lose money

Meanwhile, Jerome Powell, the Federal Reserve chair hinted that the bank will continue cutting interest rates and also slow down its quantitative tightening policy that has reduced the bank's balance sheet by trillions in the past few years.

Powell maintained that the bank is concerned by the double-whammy of high inflation and rising unemployment rate. While the BLS did not publish the September jobs numbers, a private sector survey by ADP revealed the economy lost 36,000 jobs.

The Fed is also concerned about the ongoing government shutdown, which is expected to have a $70 billion hit on the GDP a week the longer it continues. Polymarket polling data shows most traders expect the shutdown to end either later this month or in November.

EURUSD Chart by TradingViewAUD/USD Technical Analysis

The daily timeframe chart shows that the AUD/USD exchange rate has been under pressure in the past few weeks, moving from a high of 0.6705 to a low of 0.6440 on Tuesday.

It has moved between the lower and middle line of the Bollinger Bands indicator. Most importantly, it has formed a hammer candlestick pattern, which is characterized by a long lower shadow and a small body, often without an upper shadow.

Therefore, the hammer pattern points to more upside in the near term, with the next key resistance level to watch being at 0.6600. The bullish forecast will become invalid if it drops below the lower side of the hammer at 0.6440.

Ready to trade our daily Forex signals ? Here's a list of some of the best Forex platforms in Australia to check out

MENAFN15102025000131011023ID1110198946


Legal Disclaimer:
MENAFN provides the information “as is” without warranty of any kind. We do not accept any responsibility or liability for the accuracy, content, images, videos, licenses, completeness, legality, or reliability of the information contained in this article. If you have any complaints or copyright issues related to this article, kindly contact the provider above.