403
Sorry!!
Error! We're sorry, but the page you were looking for doesn't exist.
BTC/USD Forex Signal 15/10: Pattern Points To A Crash -Chart
(MENAFN- Daily Forex) Bearish view
- Sell the BTC/USD pair and set a take-profit at 107,100. Add a stop-loss at 116,000. Timeline: 1-2 days.
- Buy the BTC/USD pair and set a take-profit at 116,000. Add a stop-loss at 107,100.
Bitcoin price also wavered as investors remained in the sidelines following last week's crash. Data shows that spot Bitcoin ETFs have had a net outflow of over $300 million this week.
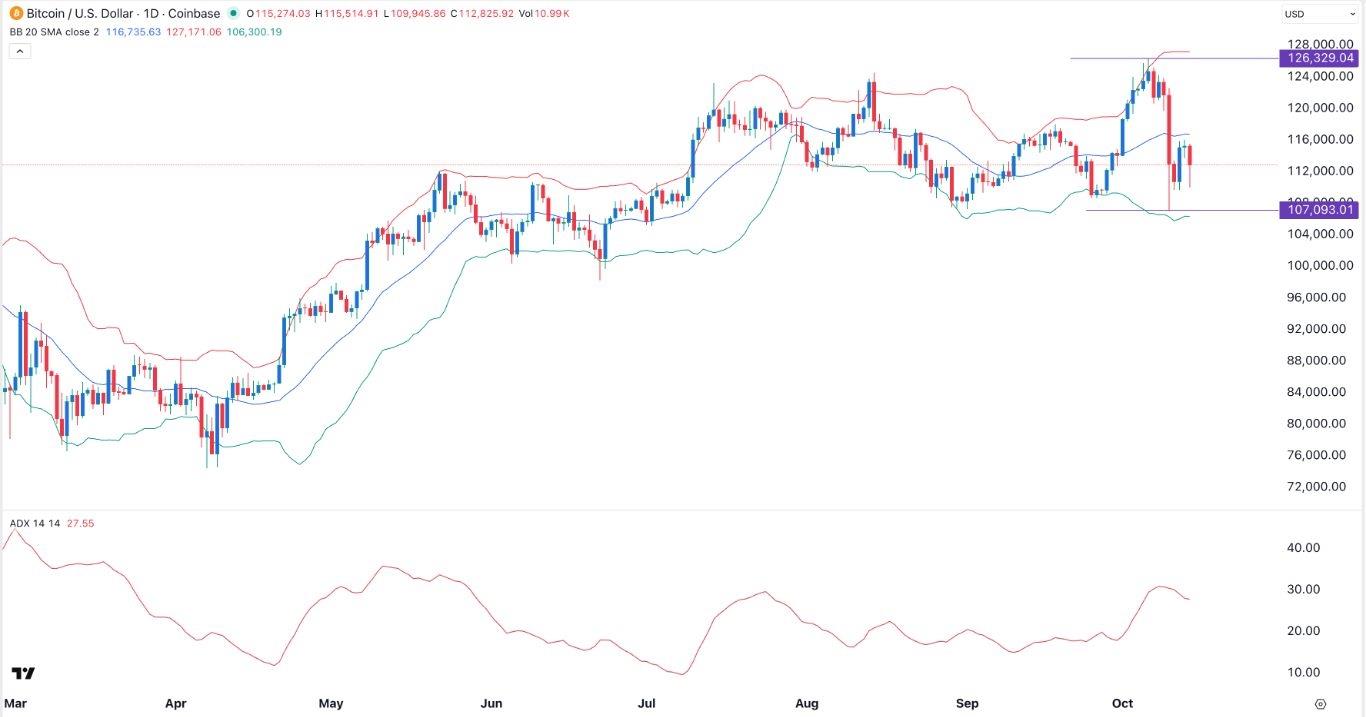
EURUSD Chart by TradingViewThe BTC/USD pair also remained under pressure after the Federal Reserve Chair delivered highly dovish statement in an economic event. He hinted that the bank will end its quantitative tightening policy, which has contributed to the tighter monetary policy.Top Forex Brokers1 Get Started 74% of retail CFD accounts lose money Also, Powell hinted that the bank will cut interest rates in the next meeting, citing the deteriorating labor market in the country. Bitcoin and other risky assets normally do well when the bank is cutting rates/USD Technical AnalysisThe daily chart shows that the BTC/USD pair peaked at over 126,000 earlier this month and dropped to the current 112,520. It has become highly volatile as evidenced by the widening spread of the three lines of the Bollinger Bands and the rising Average Directional Index (ADX).The pair has formed a bearish flag pattern and moved below the 50-day moving average. Therefore, the most likely scenario is where it has a bearish breakout with the next target being last week's low of 107,100. A move above the important resistance at 115,000 will invalidate the bearish outlook.Ready to trade our free Forex signals ? Here are the best MT4 crypto brokers to choose from.
Legal Disclaimer:
MENAFN provides the
information “as is” without warranty of any kind. We do not accept
any responsibility or liability for the accuracy, content, images,
videos, licenses, completeness, legality, or reliability of the information
contained in this article. If you have any complaints or copyright
issues related to this article, kindly contact the provider above.
Most popular stories
Market Research

- PU Prime Launches Halloween Giveaway: Iphones, Watches & Cash Await
- Ozzy Tyres Grows Their Monsta Terrain Gripper Tyres Performing In Australian Summers
- Edgen Launches Multi‐Agent Intelligence Upgrade To Unify Crypto And Equity Analysis
- Zeni.Ai Launches First AI-Powered Rewards Business Debit Card
- M2 Capital Announces $21 Million Investment In AVAX Digital Asset Treasury, AVAX One
- Tria Raises $12M To Be The Leading Self-Custodial Neobank And Payments Infrastructure For Humans And AI.


Comments
No comment