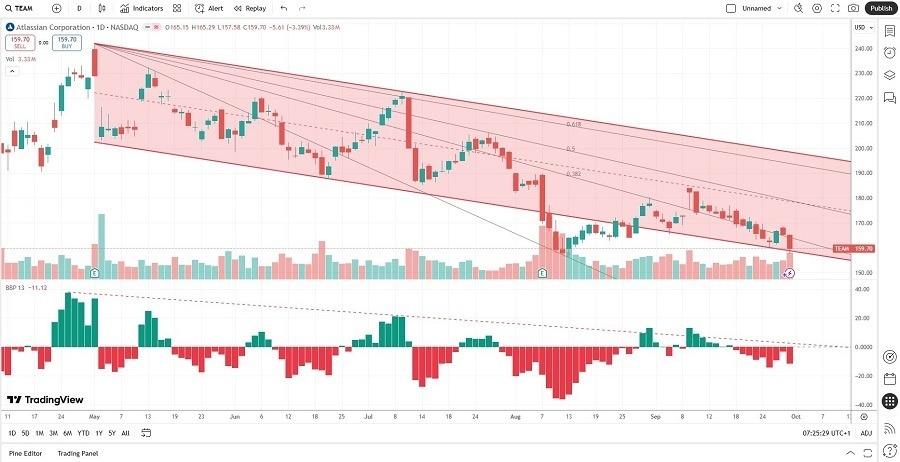
(MENAFN- Daily Forex) Short Trade IdeaEnter your short position between $157.29 (the intra-day low that touched the 0.0% Fibonacci Retracement Fan level) and $167.19 (the intra-day high of its last bullish candlestick).Market Index Analysis Atlassian (TEAM) is a member of the NASDAQ 100 Index . This index continues to ride the AI wave higher with underlying technical breakdown signals. The Bull Bear Power Indicator of the NASDAQ 100 shows a negative divergence and does not support the uptrend.
Market Sentiment AnalysisEquity futures were in the red after the US government shutdown, with both political parties blaming each other for not acting in the country's best interest. It is the first government shutdown since 2018, but at this point, it is more a matter of political theatrics than policy. Investors may not receive the September NFP payroll report and other essential economic reports, which could distract from underlying economic weakness, stubborn core inflation, and the expanding AI bubble Fundamental AnalysisAtlassian is a proprietary software company specializing in collaboration tools for software development and project management. It employs over 12,000 employees in 14 countries, serving more than 300,000 customers in over 200 countries.So, why am I bearish on TEAM after its more than 33% correction?Years of negative earnings, failure to embrace the AI hype, negative returns on assets and equity, and high valuations are reasons I see the sell-off extend from current levels. While its latest acquisition announcement of DX is a step in the right direction for TEAM, it must show investors that its business strategy can yield results. Until then, driven by vast underperformance compared to its software peers, the sell-off could resume.
| Metric | Value | Verdict |
| P/E Ratio | 43.40 | Bearish |
| P/B Ratio | 32.49 | Bearish |
| PEG Ratio | 1.66 | Bullish |
| Current Ratio | 1.22 | Bearish |
| ROIC-WACC Ratio | N/A (negative earnings) | Bearish The price-to-earning (P/E) ratio of 43.40 makes TEAM an expensive stock. By comparison, the P/E ratio for the NASDAQ 100 is 33.12.The average analyst price target for TEAM is $250.24. While this suggests excellent upside potential, I believe downgrades will follow its next earnings release Technical AnalysisToday's TEAM Signal The TEAM D1 chart shows price action inside a bearish price channel. It also shows price action breaking down below the descending 38.2% Fibonacci Retracement Fan level. The Bull Bear Power Indicator is bearish with a descending trendline. The average trading volumes are higher during bearish days than during bullish days. TEAM corrected as the NASDAQ 100 Index rallied to fresh highs, a significant bearish trading signal. My Call on AtlassianI am taking a short position in TEAM between $157.29 and $167.19. Despite underlying operational issues and missing out on the AI hype over the past three years, valuations are high. I am selling alongside the bearish price channel, supported by bearish trading volumes. TEAM Entry Level: Between $157.29 and $167.19 TEAM Take Profit: Between $121.28 and $128.02 TEAM Stop Loss: Between $175.25 and $180.24 Risk/Reward Ratio: 2.01 Ready to trade our daily stock signals ? Here is our list of the best stock brokers worth reviewing. |
MENAFN01102025000131011023ID1110138231
Legal Disclaimer:
MENAFN provides the
information “as is” without warranty of any kind. We do not accept
any responsibility or liability for the accuracy, content, images,
videos, licenses, completeness, legality, or reliability of the information
contained in this article. If you have any complaints or copyright
issues related to this article, kindly contact the provider above.


Comments
No comment