403
Sorry!!
Error! We're sorry, but the page you were looking for doesn't exist.
BTC/USD Forex Signal 27/08: Bitcoin Bears In Control (Chart)
(MENAFN- Daily Forex) Bearish view
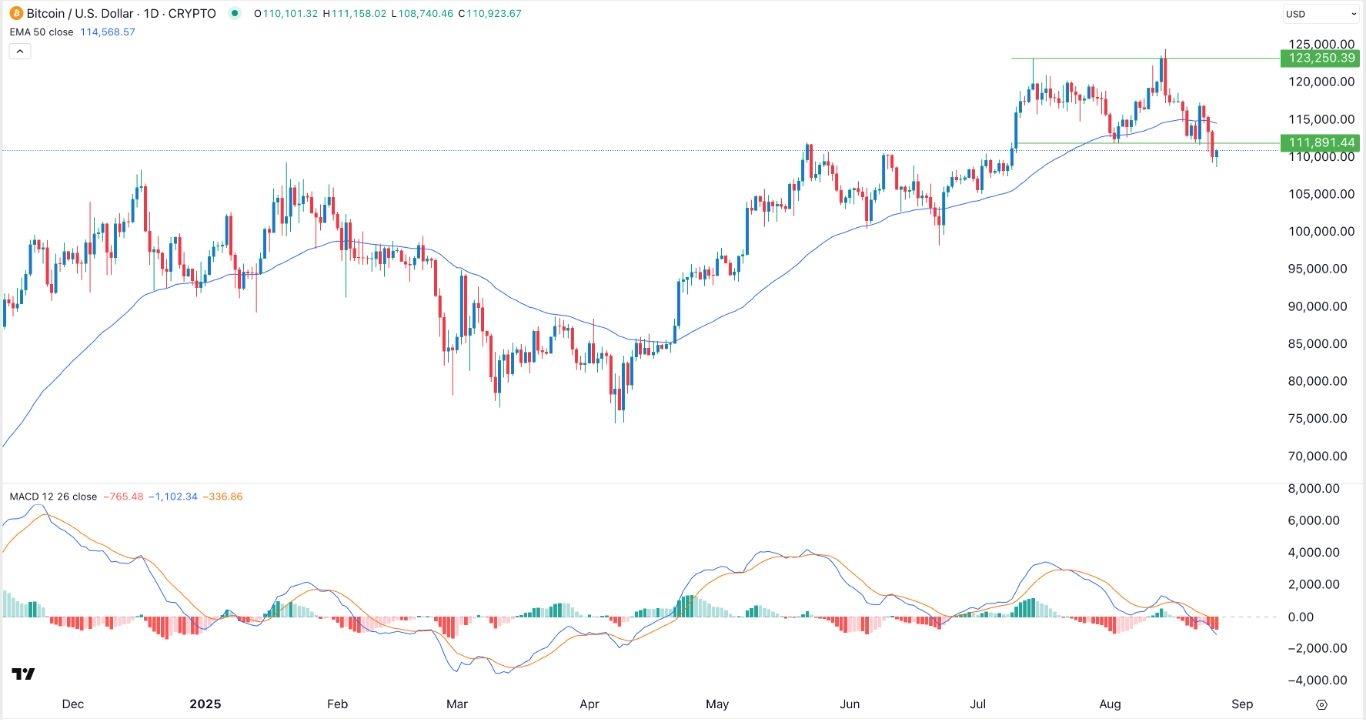
- Sell the BTC/USD pair and set a take-profit at 105,000. Add a stop-loss at 114,500. Timeline: 1-2 days.
- Buy the BTC/USD pair and set a take-profit at 114,500. Add a stop-loss at 105,000.
The BTC/USD pair is also waiting for the upcoming NVIDIA earnings, which will provide more color on the state of the artificial intelligence industry, which has been driving the stock market in the past few years.
EURUSD Chart by TradingViewBTC/USD Technical AnalysisThe daily timeframe chart shows that the BTC price has come under pressure in the past few days. This retreat happened after it formed a double-top pattern at 123,250 and a neckline at 112,000, its lowest point on August 1.The BTC/USD has plunged below the 50-day Exponential Moving Average, while top oscillators have continued moving downwards, with the two lines of the MACD indicator moving below the zero line.Therefore, the pair will likely continue falling, with the next target level to watch being at 105,000. A move above the 50-day moving average at 114,000 will invalidate the bullish outlook and signal further downside to 100,000.Ready to trade our free Forex signals ? Here are the best MT4 crypto brokers to choose from.
Legal Disclaimer:
MENAFN provides the
information “as is” without warranty of any kind. We do not accept
any responsibility or liability for the accuracy, content, images,
videos, licenses, completeness, legality, or reliability of the information
contained in this article. If you have any complaints or copyright
issues related to this article, kindly contact the provider above.


Comments
No comment