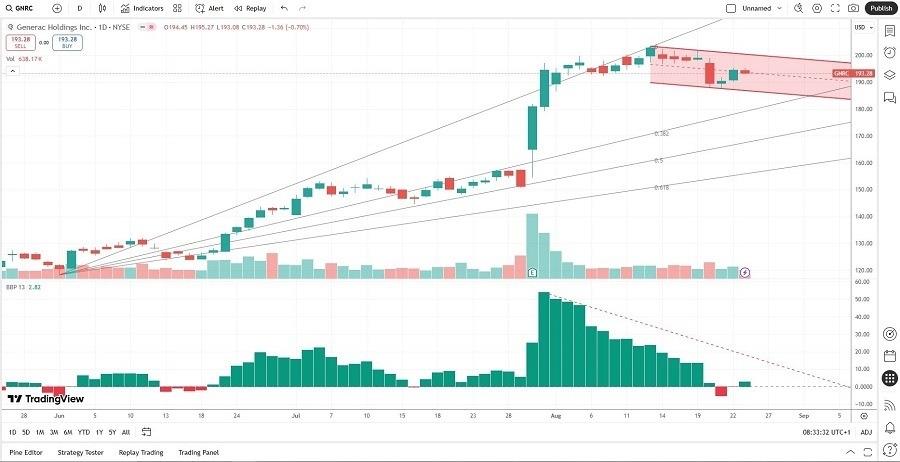
(MENAFN- Daily Forex) Short Trade IdeaEnter your short position between 187.51 (the intra-day low preceding a two-day bounce) and 195.27 (yesterday's intra-day high).Market Index Analysis Generac Holdings (GNRC) is a member of the S&P 500 This index trades near record highs, with average bearish volumes higher than bullish ones The Bull Bear Power Indicator of the S&P 500 shows a negative divergence
Market Sentiment AnalysisPresident Trump has threatened China with tariffs of up to 200% if it restricts the export of magnets to the US. He also touted higher leverage in trade negotiations by withholding Boeing parts, claiming over 200 aircraft were unable to fly due to his actions. He added that countries that levy digital taxes on US companies would face stiff tariffs and export restrictions on US chips. Finally, he told US Federal Reserve Governor Cook that he fired her, but she stated that he lacks the authority to do so. Bearish sentiment is likely to dominate today and extend losses Holdings Fundamental AnalysisGenerac Holdings is a Fortune 1000 American manufacturer of residential, light commercial, and industrial power systems with outputs ranging from 800 watts to 9 megawatts.So, why am I bearish on GNRC despite its positive earnings release?Generac Holdings touts its role in data centers due to its back-up generators, but I believe its outlook is too optimistic. High valuations, a decline in free cash flow, and diminishing capital returns may hinder its ability to deliver on its objectives. GNRC trails its competitors, and there is no catalyst on the horizon to change the dynamic. Contracting profit margins stand out, and GNRC spends more capital to maintain a stagnant market position Holdings Fundamental Analysis Snapshot
| Metric | Value | Verdict |
| P/E Ratio | 32.16 | Bearish |
| P/B Ratio | 4.41 | Bearish |
| PEG Ratio | 1.80 | Bullish |
| Current Ratio | 2.00 | Bullish |
| ROIC-WACC Ratio | Positive | Bullish The price-to-earnings (P/E) ratio of 32.16 makes GNRC an expensive stock. By comparison, the P/E ratio for the S&P 500 is 29.84.The average analyst price target for GNRC is 199.44. It suggests limited upside potential from current levels Holdings Technical AnalysisToday's GNRC Signal The GNRC D1 chart shows a price action drifting lower inside a bearish price channel. It also shows price action approaching its ascending 38.2% Fibonacci Retracement Fan levels The Bull Bear Power Indicator is bullish but has contracted since August The average bearish trading volumes are higher than the average bullish trading volumes GNRC advanced with the S&P 500, but bearish signals have overtaken bullish factors My CallTop Forex Brokers1 Get Started 74% of retail CFD accounts lose money I am taking a short position in GNRC between 187.51 and 195.27. While its latest earnings release sparked a rally, I see more downside ahead as fundamental and technical factors flash red. Decreasing free cash flow and eroding returns on capital flash stand, with lofty expectations. GNRC Entry Level: Between 187.51 and 195.27 GNRC Take Profit: Between 150.67 and 154.49 GNRC Stop Loss: Between 199.94 and 203.25 Risk/Reward Ratio: 2.96 Ready to trade our free daily signals? Here is our list of the best brokers for trading worth checking out. |
MENAFN26082025000131011023ID1109979254
Legal Disclaimer:
MENAFN provides the
information “as is” without warranty of any kind. We do not accept
any responsibility or liability for the accuracy, content, images,
videos, licenses, completeness, legality, or reliability of the information
contained in this article. If you have any complaints or copyright
issues related to this article, kindly contact the provider above.


Comments
No comment