403
Sorry!!
Error! We're sorry, but the page you were looking for doesn't exist.
USD/MXN Forecast 18/08: Holds Firm Against Peso (Chart)
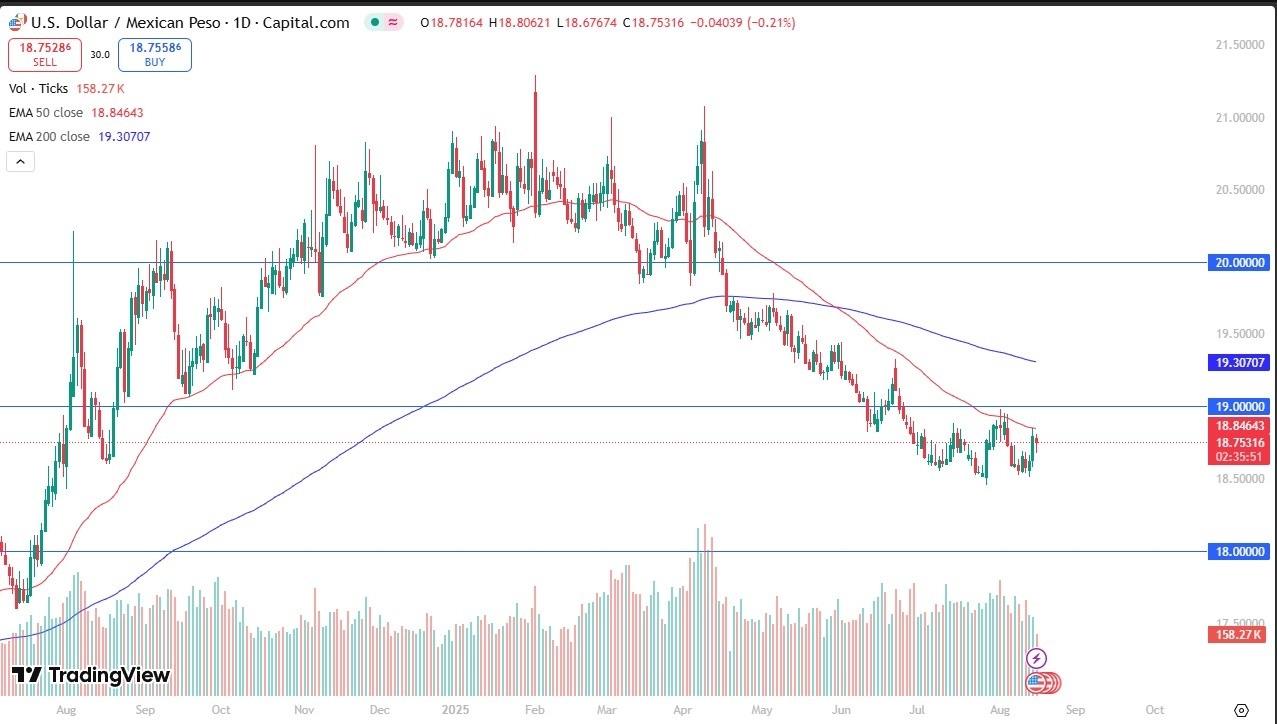
(MENAFN- Daily Forex) The US dollar moved back and forth during most of the trading session on Friday against the Mexican peso, as we are approaching fairly significant technical levels being said, you should keep in mind that the interest rate differential most certainly favors the Mexican peso, and we have to ask questions as to where the US economy is going to be heading in the short term CorrelationKeep in mind that it is a bit of an inverse correlation to the US economy in this currency pair. What I mean by this is that the better the US economy does, the better the Mexican peso will do. This is because Mexico sends so many exports into the United States that the Mexican peso is somewhat reliant on economic activity in the United States, and of course, remittances from Mexican citizens living in the US. At this point, the US economy does seem to be slowing down a bit and that could be part of why we have seen this pair bounce a bit over the last couple of days. Nonetheless, we have some technical analysis to think about before we get too aggressive in one direction or the other. Top Forex Brokers 1 Get Started 74% of retail CFD accounts lose money Read Review BrokerGeoLists({ type: \u0027MobileTopBrokers\u0027, id: \u0027mobile-top-5\u0027, size: SidebarBrokerListAmount, getStartedText: \u0060Get Started\u0060, readReviewText: \u0060Read Review\u0060, Logo: \u0027broker_carrousel_i\u0027, Button: \u0027broker_carrousel_n\u0027, });Technical AnalysisThe 50 Day EMA sits just above current pricing, parked at the 18.84 MXN level. If we can break above there, then it\u0026rsquo;s likely that the market could go looking to the 19 MXN level, so I think somewhere in that overall region, we could very well see a certain amount of exhaustion. On some type of larger wick for the daily candlestick, I will be shorting this pair. EURUSD Chart by TradingView If we can break above the 19 MXN level, then it\u0026rsquo;s possible that we could go looking to the 200 Day EMA, near the 19.30 MXN level. On the downside, if we break down below the bottom of the candlestick for the Friday session, then it probably sends this market looking to the 18.50 MXN level.

Legal Disclaimer:
MENAFN provides the
information “as is” without warranty of any kind. We do not accept
any responsibility or liability for the accuracy, content, images,
videos, licenses, completeness, legality, or reliability of the information
contained in this article. If you have any complaints or copyright
issues related to this article, kindly contact the provider above.


Comments
No comment