BTC/USD Signal Today - 25/06: Bitcoin Gets Oversold (Chart)


(MENAFN- Daily Forex) Bearish view

  • Sell the BTC/USD pair and set a take-profit at 56,500.
  • Add a stop-loss at 64,000.
  • Timeline: 1-2 days.
Bullish view
  • Set a buy-stop at 61,000 and a take-profit at 63,500.
  • Add a stop-loss at 56,500.

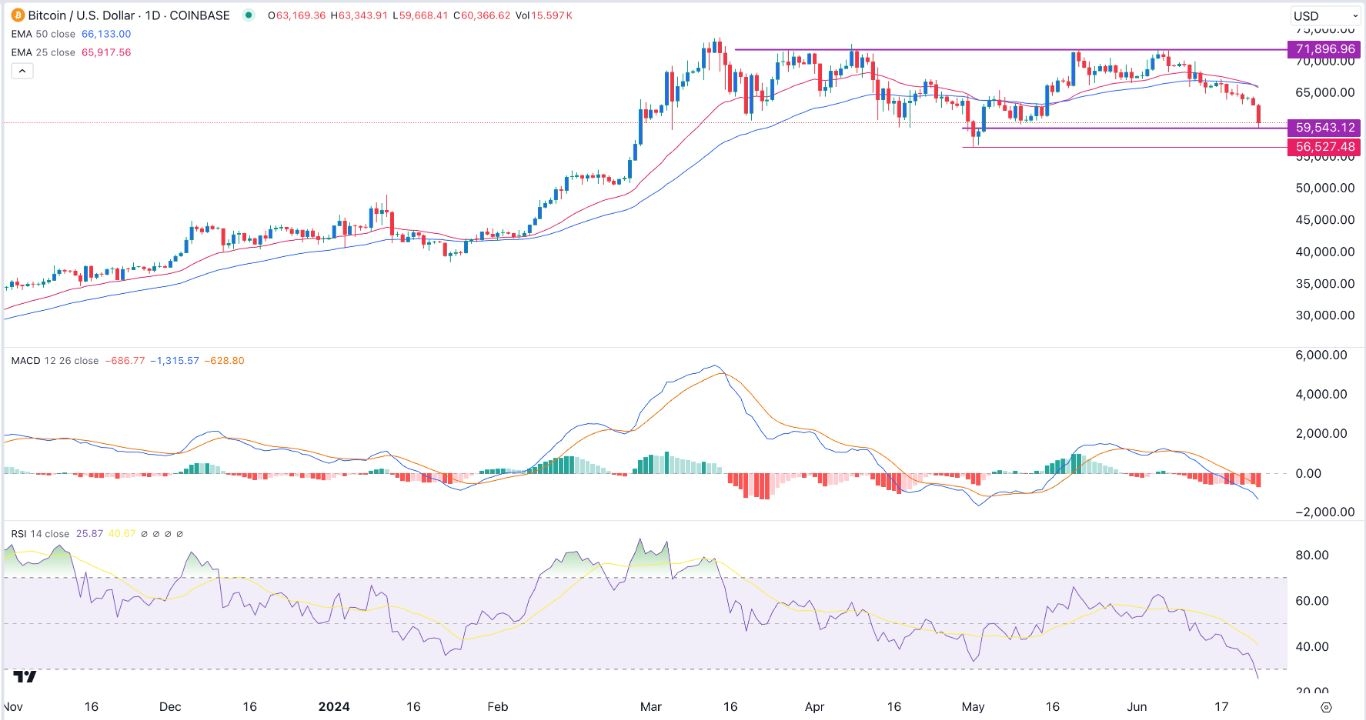
Bitcoin price continued its sell-off this week as it moved below the crucial support level of $60,000 for the first time since May 3rd. The BTC/USD pair dropped to a low of 59,540, much lower than this month's high of 72,000 retreat continues

The price of bitcoin has been in a strong downtrend after peaking at $72,000 earlier this month. This retreat happened as the volume of Bitcoin outflows from spot ETFs like the IBIT, FBTC, and ARKB continued. Altogether, the eleven spot Bitcoin ETFs have shed over $1 billion in assets recently.

Bitcoin's sell-off also happened as Germany continued selling over $3 billion worth of Bitcoins. Some of those coins were then bought by Michael Saylor's MicroStrategy, the biggest holder of Bitcoin in the world. There is additional selling pressure from mining companies that have disposed tokens worth millions recently.

Meanwhile, there are signs that Mt, the collapsed crypto exchange, has started selling Bitcoins to reimburse customers. All this selling has affected the price of Bitcoin by increasing supply at a time of low demand.

Top Forex Brokers
  • 1 Get Started 74% of retail CFD accounts lose money

There are also concerns about the Federal Reserve, which has maintained higher interest rates for longer. In its monetary meeting recently, the Fed left interest rates unchanged and signalled that it will deliver one rate cut this year. Earlier this year, most investors were expecting at least three cuts in 2024.

Still, some analysts believe that Bitcoin has room to rebound. For one, the upcoming election in the US is seen as a positive move since Trump has come out in support of Bitcoin and other cryptocurrencies.

Also, this consolidation and pullback is part of the post-halving cycle that takes a few months. Further, Summer has historically been a down month for Bitcoin and other cryptocurrencies/USD technical analysis

The daily chart shows that the BTC/USD pair has been in a strong bearish trend in the past few weeks. This sell-off started when it formed a double-top pattern at 72,000 earlier this month. In most periods, a double-top is usually a bearish sign.

The 50-day and 25-day Exponential Moving Averages (EMA) have done a bearish crossover while the MACD and the Relative Strength Index (RSI) have all pointed downwards. It has become oversold as the RSI has moved below 30.

Therefore, the pair will likely continue falling as sellers target the key support level at 56,527, its lowest point in May.

Ready to trade our free trading signals ? We've made a list of the best Forex crypto brokers worth trading with.

MENAFN25062024000131011023ID1108372290


Daily Forex

Legal Disclaimer:
MENAFN provides the information “as is” without warranty of any kind. We do not accept any responsibility or liability for the accuracy, content, images, videos, licenses, completeness, legality, or reliability of the information contained in this article. If you have any complaints or copyright issues related to this article, kindly contact the provider above.