403
Sorry!!
Error! We're sorry, but the page you were looking for doesn't exist.
Crude Oil Forecast: Is Crude Trying To Find A Bottom?
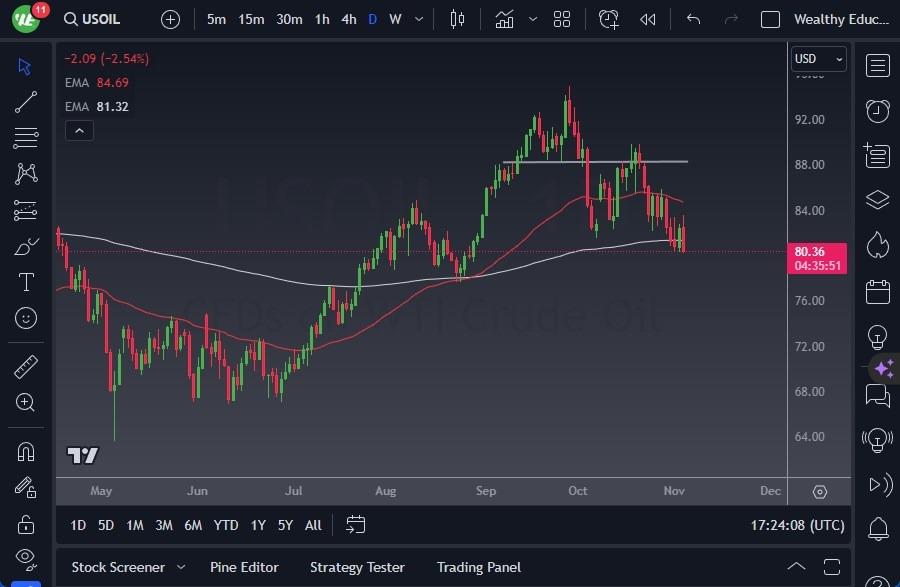
(MENAFN- Daily Forex) Crude oil markets embarked on a noteworthy rally during the day, only to give back gains. This shows just how noisy that market has been and will more likely than not continue to be. Forex Brokers We Recommend in Your Region 1 ![brkr-logo]() Read full review Get Started Starting with WTI Crude Oil, the West Texas Intermediate Crude Oil market initially displayed signs of strength during Friday's trading session. However, it abruptly reversed course upon encountering the 50-Day Exponential Moving Average, signaling a shift towards negativity. The 50-Day EMA is a widely watched technical indicator, drawing the attention of many traders. Should we manage to breach this crucial level, it could pave the way for sustained bullish momentum, potentially leading to a climb towards the $85 mark. Beyond that, breaking above $85 might open doors for an ascent to $90. The looming question centers on whether the current momentum is sufficient to propel further upward movement or if we have just witnessed the formation of a potential "double bottom" pattern.On the downside, the 200-Day EMA is converging toward the $80 threshold, presenting itself as a substantial support level. Despite the inherent noise in this market, it appears increasingly likely that buyers will emerge in due course. In fact, it literally tends to go back and forth with the latest headlines coming out of the Middle East Market is Characterized by a Substantial VolatilityShifting our focus to Brent, similar patterns emerge. Brent markets experienced a significant rally during Friday's trading session but relinquished their gains upon reaching the 50-Day EMA. Currently, the market finds itself in a zone sandwiched between the 50-Day EMA and the 200-Day EMA indicators, which typically results in heightened market noise. The $85 level below holds considerable significance as a psychological marker, where we have previously observed both support and resistance.That being said, there's a compelling argument to be made that the market may have recently formed a double bottom pattern. It appears more plausible that we could see an upward trajectory than a downward one, but as prudent traders, we must observe the market's actions rather than making assumptions. If the 50-Day EMA is surpassed, our attention should shift to the $90 level, followed by the $92.50 level.In essence, the oil market remains characterized by substantial volatility, with short-term sideways trading taking precedence. For traders inclined towards short-term consolidation strategies, this market may present favorable trading opportunities. This will favor oscillators such as the Stochastic Oscillators, and similar technical indicators.Ready to trade WTI Crude Oil FX ? We've shortlisted the best Forex Oil trading brokers in the industry for you.
Read full review Get Started Starting with WTI Crude Oil, the West Texas Intermediate Crude Oil market initially displayed signs of strength during Friday's trading session. However, it abruptly reversed course upon encountering the 50-Day Exponential Moving Average, signaling a shift towards negativity. The 50-Day EMA is a widely watched technical indicator, drawing the attention of many traders. Should we manage to breach this crucial level, it could pave the way for sustained bullish momentum, potentially leading to a climb towards the $85 mark. Beyond that, breaking above $85 might open doors for an ascent to $90. The looming question centers on whether the current momentum is sufficient to propel further upward movement or if we have just witnessed the formation of a potential "double bottom" pattern.On the downside, the 200-Day EMA is converging toward the $80 threshold, presenting itself as a substantial support level. Despite the inherent noise in this market, it appears increasingly likely that buyers will emerge in due course. In fact, it literally tends to go back and forth with the latest headlines coming out of the Middle East Market is Characterized by a Substantial VolatilityShifting our focus to Brent, similar patterns emerge. Brent markets experienced a significant rally during Friday's trading session but relinquished their gains upon reaching the 50-Day EMA. Currently, the market finds itself in a zone sandwiched between the 50-Day EMA and the 200-Day EMA indicators, which typically results in heightened market noise. The $85 level below holds considerable significance as a psychological marker, where we have previously observed both support and resistance.That being said, there's a compelling argument to be made that the market may have recently formed a double bottom pattern. It appears more plausible that we could see an upward trajectory than a downward one, but as prudent traders, we must observe the market's actions rather than making assumptions. If the 50-Day EMA is surpassed, our attention should shift to the $90 level, followed by the $92.50 level.In essence, the oil market remains characterized by substantial volatility, with short-term sideways trading taking precedence. For traders inclined towards short-term consolidation strategies, this market may present favorable trading opportunities. This will favor oscillators such as the Stochastic Oscillators, and similar technical indicators.Ready to trade WTI Crude Oil FX ? We've shortlisted the best Forex Oil trading brokers in the industry for you.

Legal Disclaimer:
MENAFN provides the
information “as is” without warranty of any kind. We do not accept
any responsibility or liability for the accuracy, content, images,
videos, licenses, completeness, legality, or reliability of the information
contained in this article. If you have any complaints or copyright
issues related to this article, kindly contact the provider above.


Comments
No comment