


403
Sorry!!
Error! We're sorry, but the page you were looking for doesn't exist.

Sterling Price Outlook: British Pound Surges into Critical Resistance
(MENAFN- DailyFX)
- British PoundT now targeting initial test of trend resistance- 1.2374-1.2433 Critical
- Check out our 2019 projections in ourFree DailyFX GBP/USD Trading Forecasts
- Join Michael for Live Weekly Strategy Webinars onMondays at 12:30GMT
Sterlingsurged this week with theBritish Poundrallying more than 2.7% against theUS Dollarto trade at 1.2660 ahead of the New York close on Friday. The rally marks the largest single-week advance since September of 2017 and takes price into a critical resistance zone at trend extremes. These are the updated targets and invalidation levels that matter on the GBP/ USDweekly price chart.Review my latestWeekly Strategy Webinarfor an in-depth breakdown of this Sterling price setup and more.
New to ForexTrading? Get started with thisFree Beginners Guide
Sterling Price Chart - GBP/USD Weekly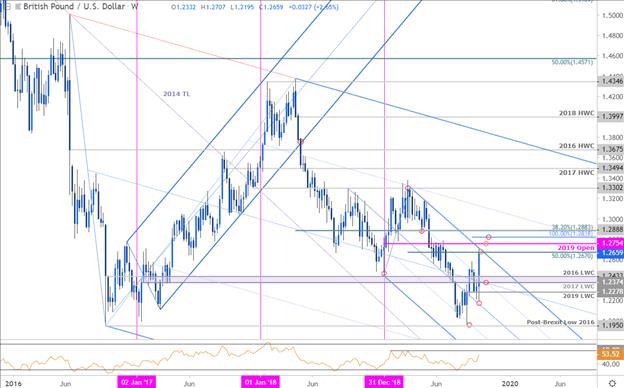
Chart Prepared byMichael Boutros , Technical Strategist;GBP/USD on Tradingview
Notes:Sterling posted a 4.2% range this week with price reversing off the median-line of a the descendingpitchfork formationwe've been tracking off the late-2018 / 2019 highs. The rally is now testing the upper parallel / 50% retracement around ~1.2670/90 and a breach / close above this threshold is needed to validate a larger breakout in the British Pound.
Subsequent topside resistance objectives are stacked just higher at the yearly open at 1.2754, the 100% extension at 1.2818 and the 38.2%retracementof the 2018 decline at 1.2883. Interim support now rests at the 2017 low-week close at 1.2374 backed closely by near-term bullish invalidation at the September low-week close at 1.2278.
For a complete breakdown of Michael's trading strategy, review hisFoundations of Technical Analysis series on Building a Trading Strategy
Bottom line:Sterling is testing BIG downtrend resistance here and the focus is on a breach of this key technical resistance confluence. From at trading standpoint, the immediate advance may be vulnerable here, but the broader focus remains higher while above 1.2278. From a trading standpoint a good spot to reduce long-exposure / raise protective stops – we'll favor fading weakness while above the low-week close targeting a topside breach / breakout of this formation. I'll publish an updatedSterling Price Outlookonce we get further clarity on the near-termGBP/USDtechnical trade levels.
Sterling Trader Sentiment (GBP/USD)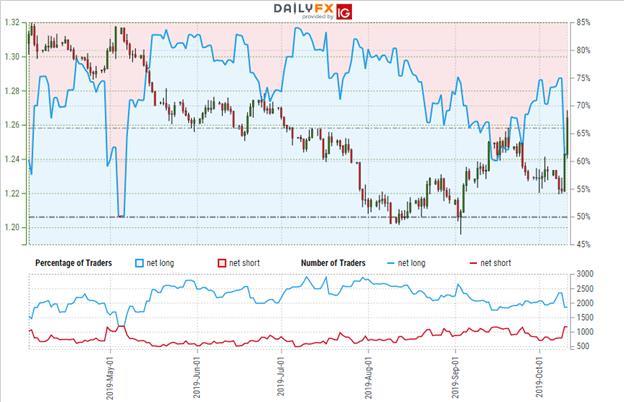
- A summary ofIG Client Sentimentshows traders are net-long GBP/ USD- the ratio stands at +1.64 (62.16% of traders are long) – bearish reading
- Long positions are22.55% lower than yesterday and 17.64% lower from last week
- Short positions are 26.52% higher than yesterday and 29.39% higher from last week
- We typically take a contrarian view to crowd sentiment, and the fact traders are net-long suggests GBP/USD prices may continue to fall. Yet traders are less net-long than yesterday and compared with last week. Recent changes in sentiment warn that the current GBP/USD price trend may soon reverse higher despite the fact traders remain net-long.
See how shifts in GBP/USD retail positioning are impacting trend-Learn more about sentiment!
---
Previous Weekly Technical Charts
- Gold (XAU/USD)
- Silver (XAG/USD)
- Euro (EUR/USD)
- Crude Oil (WTI)
- Japanese Yen (USD/JPY)
- Canadian Dollar (USD/CAD)
- US Dollar Index (DXY)
Learn how to Trade with Confidence in our Free Trading Guide
-p-- Written byMichael Boutros , Technical Currency Strategist with DailyFXFollow Michael on Twitter@MBForex

Legal Disclaimer:
MENAFN provides the
information “as is” without warranty of any kind. We do not accept
any responsibility or liability for the accuracy, content, images,
videos, licenses, completeness, legality, or reliability of the information
contained in this article. If you have any complaints or copyright
issues related to this article, kindly contact the provider above.
Most popular stories
Market Research

More Story


Comments
No comment