


403
Sorry!!
Error! We're sorry, but the page you were looking for doesn't exist.

Cotton Wave Analysis 20 August, 2019
(MENAFN- FxPro)
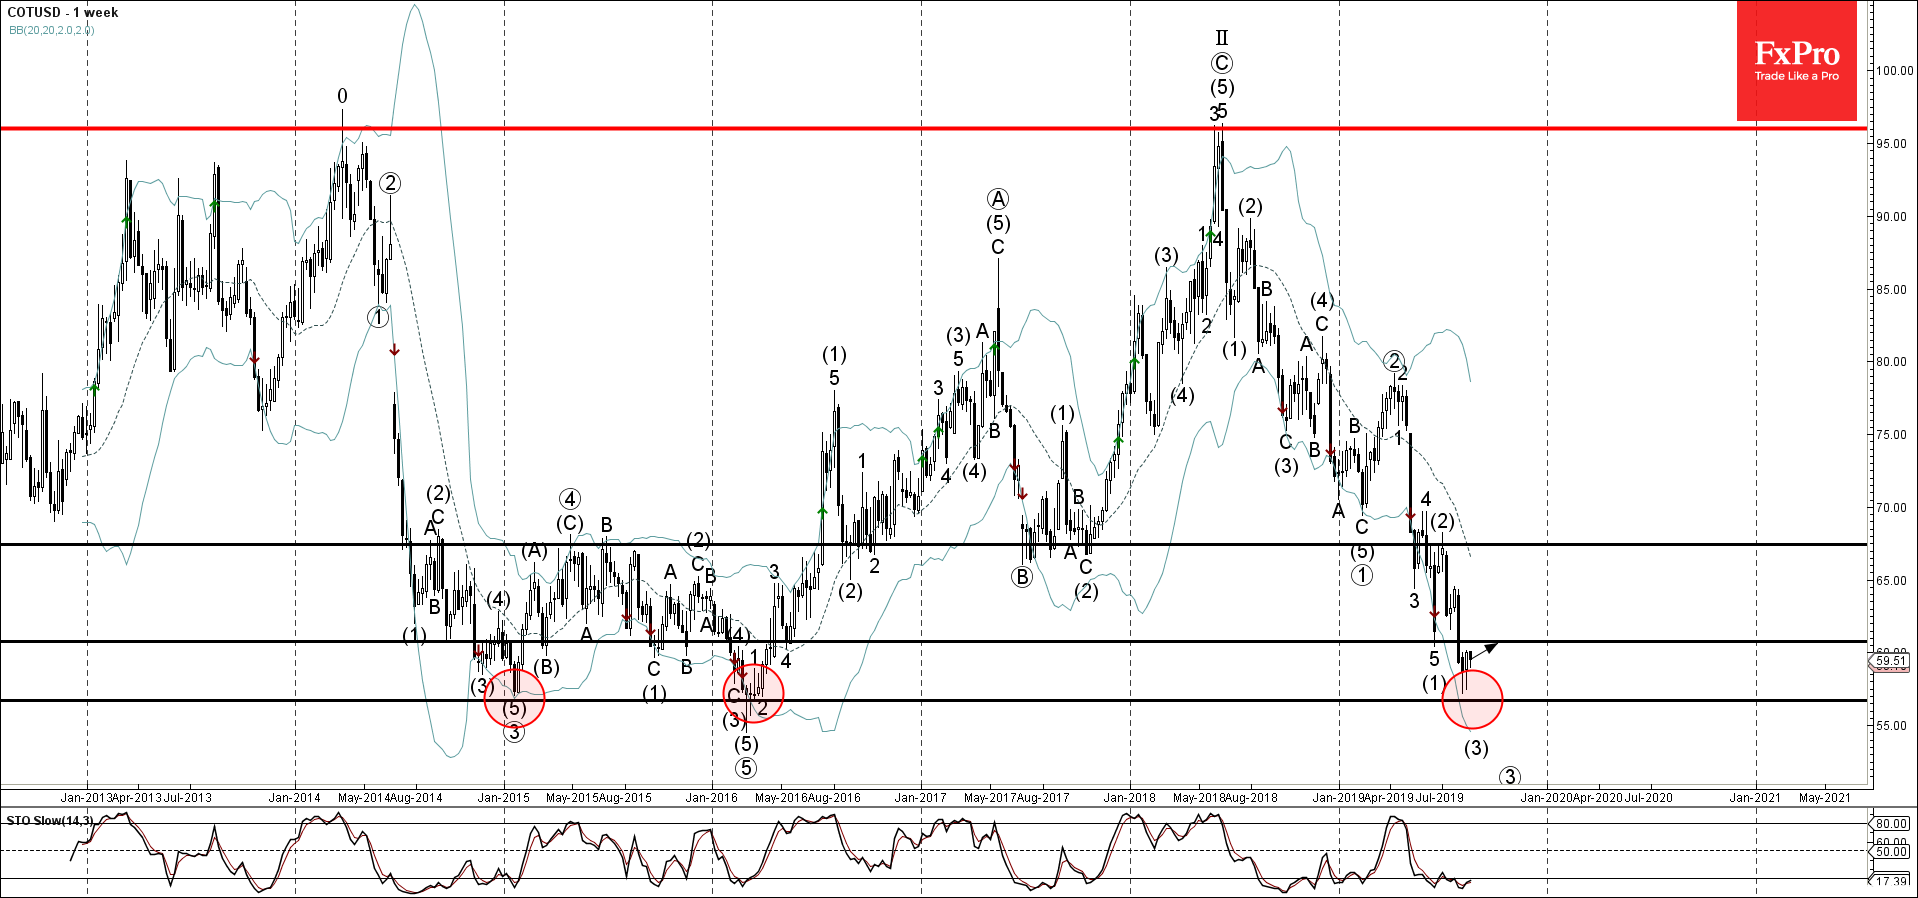
- Cotton reversed from support area
- Further gains are likely
Cotton recently reversed up from the support area lying between the multi-year support level 56.70 (which has been reversing the price from 2015) and the lower weekly Bollinger Band.
The upward reversal from this support area created the two consecutive weekly Japanese candlesticks reversal patterns - Hammer.
Given the oversold weekly Stochastic indicator - Cotton is expected to rise further and retest the next resistance level 60.70.

Legal Disclaimer:
MENAFN provides the
information “as is” without warranty of any kind. We do not accept
any responsibility or liability for the accuracy, content, images,
videos, licenses, completeness, legality, or reliability of the information
contained in this article. If you have any complaints or copyright
issues related to this article, kindly contact the provider above.
Most popular stories
Market Research

More Story


Comments
No comment