Crude Oil Prices Soar on Saudi Purge, Iran War Worries
soared on Saudi elites purge, Iran war worries rose as geopolitical jitters cooled Fed rate hike bets OPEC, EIA and API statistics due but might be overshadowed Crude oil prices surged to the highest level since July 2015 as a purge of the Saudi elite stoked supply disruption fears. In a move reportedly engineered by ascendant Crown Price Mohammed bin Salman, security forces rounded up members of the royal family, ministers, billionaires and top officials almost immediately after King Salman announced a sweeping anti-corruption initiative.
The prospect of war with Iran compounded upward pressure. Saudi foreign minister Adel Jubair said a missile fired at Riyadh from Yemen over the weekend was an 'act of war and put the blame for the action with Tehran. This followed the abrupt resignation of Lebanese Prime Minister Saad Hariri via video while visiting his patrons in the Saudi capital, in protest of Iranian influence in local politics.Gold prices seemed to be caught up in the same narrative. The metal surged alongside the WTI crude oil benchmark while the fell as the priced-in rate hike path for 2018 flattened. Perhaps the markets reckoned that if the latest dust-up brings prolonged geopolitical instability, this might invariably lead to the kind of risk aversion that limits scope for Fed stimulus withdrawal.
There is plenty of event risk due ahead. OPEC will publish the World Oil Outlook (WOO), a comprehensive assessment of market conditions and outlook for the medium to long term. Meanwhile, the EIA will unveil its short-term projections and API will report on US inventory flows. It is unclear what any of this might mean for oil prices however if Saudi-themed news flow continues to dominate the spotlight.What is the #1 mistake that traders make, and how can you fix it? .
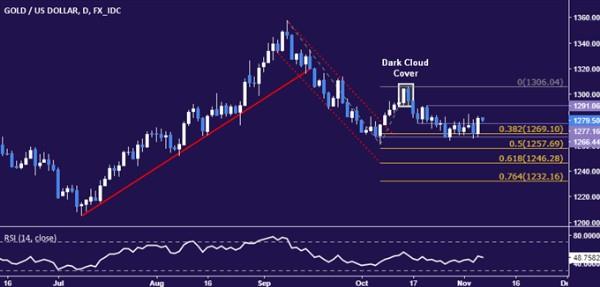
GOLD TECHNICAL ANALYSIS Gold prices reclaimed a foothold above support-turned-resistance at 1277.16. The next upside barrier comes in at 1291.06, the October 20 high, with a daily close above that opening the door for a retest of the October 16 peak at 1306.04. Alternatively, a move back below 1291.06 exposes familiar range support the 1266.44-69.10 area (October 5 low, 38.2% Fibonacci expansion).Chart created using TradingView
CRUDE OIL TECHNICAL ANALYSIS Crude oil prices continue to push higher, with buyers now aiming to challenge resistance marked by the 38.2% Fibonacci expansion at 58.92. A daily close above that exposes the 50% level at 60.48. Alternatively, a turn back below the 23.6% Fib at 57.00 targets the 55.24-81 area (14.6% expansion, January 3 high).
Chart created using TradingView
--- Written by Ilya Spivak, Currency Strategist for DailyFX.com
To receive Ilya's analysis directly via email, pleaseContact and follow Ilya on Twitter:

Legal Disclaimer:
MENAFN provides the
information “as is” without warranty of any kind. We do not accept
any responsibility or liability for the accuracy, content, images,
videos, licenses, completeness, legality, or reliability of the information
contained in this article. If you have any complaints or copyright
issues related to this article, kindly contact the provider above.


Comments
No comment