(MENAFN- Daily Forex) Short Trade IdeaEnter your short position between $133.05 (yesterday's intra-day low) and $144.30 (yesterday's intra-day high).Top Regulated Brokers1 Get Started 74% of retail CFD accounts lose money Market Index Analysis Fortinet (NASDAQ:FTNT) is a member of the NASDAQ 100 Index and the S&P 500 Index. Both indices retreat from their all-time highs, supported by rising bearish trading volumes. The Bull Bear Power Indicator for the NASDAQ 100 Index is bearish and remains below its descending trendline.
Market Sentiment AnalysisEquity futures are falling this morning amid renewed tensions between the US and Iran, while US President Trump claims a deal is days away, as he has done for several weeks. While oil prices remain well off their 2026 peak, they are still over 50% higher, and could force the US Federal Reserve, once again behind the curve, into an interest rate hike, threatening to derail the AI frenzy. Investors will also receive May's CPI report before and Oracle earnings after the bell today Fundamental AnalysisFortinet is a cybersecurity company with offices in dozens of countries. It ranks among the top-rated large-cap growth stocks and is expanding its market share through acquisitions.So, why am I bearish on FTNT despite its nearly 100% rally?Besides facing a series of downgrades and price targets as low as $67 per share, Fortinet also battles unrealistic performance expectations, including double-digit growth in billing and services revenue, as well as excessive valuations. An ongoing class action lawsuit over misleading information about its product refresh cycles represents another short-term bearish catalyst, while competitive pressures threaten its revenue stream.
| Metric | Value | Verdict |
| P/E Ratio | 55.58 | Bearish |
| P/B Ratio | 102.45 | Bearish |
| PEG Ratio | 3.12 | Bearish |
| Current Ratio | 1.15 | Bearish |
| ROIC-WACC Ratio | Positive | Bullish The price-to-earnings (P/E) ratio of 55.58 makes FTNT an expensive stock. By comparison, the P/E ratio for the NASDAQ 100 Index is 35.69.The average analyst price target for FTNT is $110.22. This suggests no upside potential with excessive downside risks Technical AnalysisToday's FTNT Signal
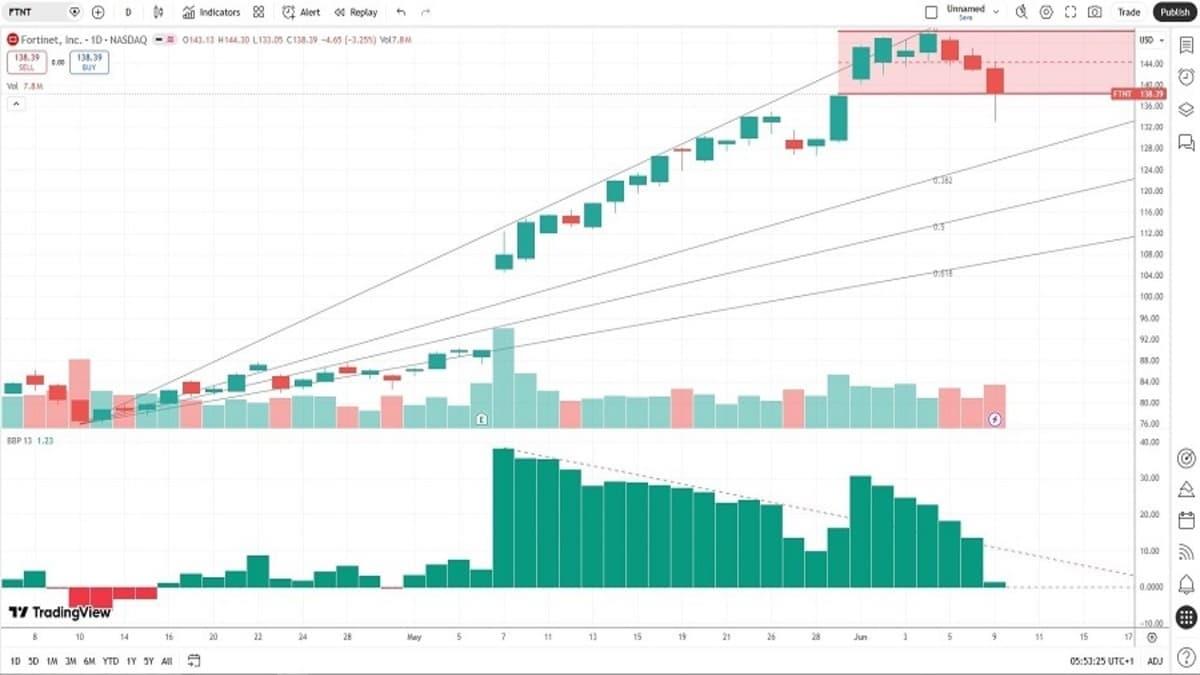
The FTNT D1 chart shows price action approaching a breakdown below its horizontal resistance zone. It also shows price action between its ascending 0.0% and 38.2% Fibonacci Retracement Fan levels. The Bull Bear Power Indicator is bullish with a descending trendline, nearing a bearish crossover. The average bullish trading volumes are higher than the average bearish trading volumes, hinting at more short-term volatility potential. FTNT corrected with the NASDAQ 100 Index, a bearish confirmation. My FTNT Short Stock Trade FTNT Entry Level: Between $133.05 and $144.30 FTNT Take Profit: Between $91.24 and $96.12 FTNT Stop Loss: Between $151.07 and $156.12 Risk/Reward Ratio: 2.32 Ready to trade our analysis of Fortinet? Here is our list of the best stockbrokers worth checking out. |
MENAFN10062026000131011023ID1111240536
Legal Disclaimer:
MENAFN provides the
information “as is” without warranty of any kind. We do not accept
any responsibility or liability for the accuracy, content, images,
videos, licenses, completeness, legality, or reliability of the information
contained in this article. If you have any complaints or copyright
issues related to this article, kindly contact the provider above.


Comments
No comment