


403
Sorry!!
Error! We're sorry, but the page you were looking for doesn't exist.
XAU/USD Analysis 02/06: Price Returns To $4,445 And Completely Changes The Scene $
(MENAFN- Daily Forex) Today's Gold Analysis Overview:
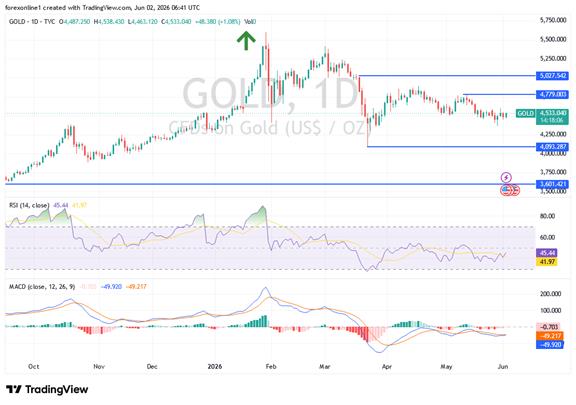
Note: These recommendations are suitable for medium-to-long-term traders, provided there is strict adherence to capital and risk managementTop Regulated Brokers1 Get Started 74% of retail CFD accounts lose money Daily Technical Analysis of Gold/US Dollar (XAU/USD):The price of gold has been experiencing cautious movements during recent trading sessions, amid overlapping geopolitical factors and US monetary policy expectations, which places the precious metal within a narrow trading range with a clear bias toward near-term downward pressure.The gold price declined to the brink of the $4,445 per ounce support, which reinforces the control of the bears. Across the best gold trading platforms, the high for the yellow metal at the start of the trading week was the resistance level of $4,546 per ounce Trend for GoldThe general trend for gold still tilts downward in the short term, with sellers maintaining control over price action, especially after prices failed to sustain their recent gains near immediate resistance levels.Conversely, any upward attempts remain contingent on the market's ability to absorb the pressures resulting from the strength of the US dollar and expectations of a prolonged period of tight monetary policy Factors Influencing Gold PricesGold prices are currently impacted by several key factors, most notably renewed geopolitical concerns in the Middle East, particularly with escalating tensions regarding energy supplies and the potential impact on oil movement through vital corridors.These developments are fueling global inflation fears, but simultaneously bolstering the strength of the US dollar, as investors tend to hedge against uncertainty in the US currency, which puts additional pressure on gold.Furthermore, forecasts indicate that sustained high energy prices could prompt central banks, led by the Federal Reserve, to keep a tight monetary policy in place for longer than expected-an additional negative factor for gold's performance Technical OutlookTechnically, gold is moving within a clear downward range on the daily timeframe, with lower highs gradually forming, reflecting the continued weakness of upward momentum. Technical indicators point to a continued bearish bias, with the Relative Strength Index (RSI) moving near weak mid-levels, while the Moving Average Convergence Divergence (MACD) indicator reflects continued downward momentum.Trading below key moving averages reinforces the medium-term downtrend, unless a clear breakout from major resistance levels occurs to reverse this trend and Resistance LevelsGold continues to move between important technical levels, where current support zones represent crucial points for determining the next directional move, while resistance levels form a barrier against any bullish recovery attempts.If prices manage to hold near support levels, we may see limited rebound attempts, while a break below these levels would signal continued selling pressure.However, if buyers manage to regain momentum, a return above key resistance levels could reopen the scenario of a gradual short-term recovery General ScenarioThe bearish scenario remains the most likely in the near term, given the ongoing strength of the dollar and increasing expectations of tight monetary policy, alongside the geopolitical uncertainty that may fuel volatility without shifting the overall trend. However, any fundamental change in inflation data or the US Federal Reserve's stance could reshape the technical picture for gold in the coming period.EURUSD Chart by TradingViewTrading Tips:Dear TradersUp trader, some traders prefer to follow a strategy of buying gold during sharp price declines, with the absolute necessity of strict adherence to capital management and setting stop-loss levels to mitigate risk. Any trade remains conditional upon additional confirmations from market action and avoiding random entries without clear technical signals.Ready to trade today's Gold forecast? Here are the best Gold brokers to choose from.
- The Overall Gold Trend: Bearish. Today's Gold Support Points: $4445 – $4410 – $4340 per ounce Today's Gold Resistance Points: $4530 – $4580 – $4640 per ounce
- Buy gold from the support level of $4410 with a target of $4600 and a stop loss at $4370. Sell gold from the resistance level of $4600 with a target of $4400 and a stop loss at $4670.
Note: These recommendations are suitable for medium-to-long-term traders, provided there is strict adherence to capital and risk managementTop Regulated Brokers1 Get Started 74% of retail CFD accounts lose money Daily Technical Analysis of Gold/US Dollar (XAU/USD):The price of gold has been experiencing cautious movements during recent trading sessions, amid overlapping geopolitical factors and US monetary policy expectations, which places the precious metal within a narrow trading range with a clear bias toward near-term downward pressure.The gold price declined to the brink of the $4,445 per ounce support, which reinforces the control of the bears. Across the best gold trading platforms, the high for the yellow metal at the start of the trading week was the resistance level of $4,546 per ounce Trend for GoldThe general trend for gold still tilts downward in the short term, with sellers maintaining control over price action, especially after prices failed to sustain their recent gains near immediate resistance levels.Conversely, any upward attempts remain contingent on the market's ability to absorb the pressures resulting from the strength of the US dollar and expectations of a prolonged period of tight monetary policy Factors Influencing Gold PricesGold prices are currently impacted by several key factors, most notably renewed geopolitical concerns in the Middle East, particularly with escalating tensions regarding energy supplies and the potential impact on oil movement through vital corridors.These developments are fueling global inflation fears, but simultaneously bolstering the strength of the US dollar, as investors tend to hedge against uncertainty in the US currency, which puts additional pressure on gold.Furthermore, forecasts indicate that sustained high energy prices could prompt central banks, led by the Federal Reserve, to keep a tight monetary policy in place for longer than expected-an additional negative factor for gold's performance Technical OutlookTechnically, gold is moving within a clear downward range on the daily timeframe, with lower highs gradually forming, reflecting the continued weakness of upward momentum. Technical indicators point to a continued bearish bias, with the Relative Strength Index (RSI) moving near weak mid-levels, while the Moving Average Convergence Divergence (MACD) indicator reflects continued downward momentum.Trading below key moving averages reinforces the medium-term downtrend, unless a clear breakout from major resistance levels occurs to reverse this trend and Resistance LevelsGold continues to move between important technical levels, where current support zones represent crucial points for determining the next directional move, while resistance levels form a barrier against any bullish recovery attempts.If prices manage to hold near support levels, we may see limited rebound attempts, while a break below these levels would signal continued selling pressure.However, if buyers manage to regain momentum, a return above key resistance levels could reopen the scenario of a gradual short-term recovery General ScenarioThe bearish scenario remains the most likely in the near term, given the ongoing strength of the dollar and increasing expectations of tight monetary policy, alongside the geopolitical uncertainty that may fuel volatility without shifting the overall trend. However, any fundamental change in inflation data or the US Federal Reserve's stance could reshape the technical picture for gold in the coming period.EURUSD Chart by TradingViewTrading Tips:Dear TradersUp trader, some traders prefer to follow a strategy of buying gold during sharp price declines, with the absolute necessity of strict adherence to capital management and setting stop-loss levels to mitigate risk. Any trade remains conditional upon additional confirmations from market action and avoiding random entries without clear technical signals.Ready to trade today's Gold forecast? Here are the best Gold brokers to choose from.

Legal Disclaimer:
MENAFN provides the
information “as is” without warranty of any kind. We do not accept
any responsibility or liability for the accuracy, content, images,
videos, licenses, completeness, legality, or reliability of the information
contained in this article. If you have any complaints or copyright
issues related to this article, kindly contact the provider above.
Most popular stories
Market Research

More Story


Comments
No comment