


403
Sorry!!
Error! We're sorry, but the page you were looking for doesn't exist.

Lovin' Normality, As The Alternatives Are Troubling
(MENAFN- ING)
We never re-hit 5% in 2025, as the deficit was broadly ignored
Source: Macrobond, ING estimates Anticipate cheapening in the belly as the curve stretches steeper
Source: Macrobond, ING estimates For Treasuries, that pitches the 10yr in the 4.25% to 4.5% area
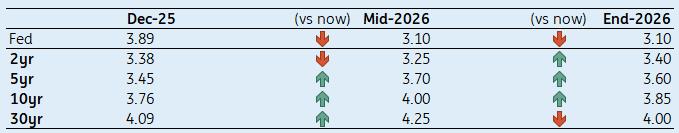
Source: Macrobond, ING estimates Here's how we see Treasury curve segments evolve through 2026 (bp)
Source: Macrobond, ING estimates Risk Bands: Impact of bigger Fed cuts than anticipated on the 10yr
When we did this exercise a year ago, we thought the 10yr yield would spend a chunk of 2025 peppering the 5% area. It reached 4.8% in mid-January and saw two more peaks at 4.6% during the first half of the year, but in the end, the 10yr yield is practically back down to levels that we saw a year ago.
In fact, over the past year, the 10yr yield has averaged 4.3%, while core inflation has averaged 3%. That's an average delivered 10yr real yield of 1.3%, which is low. The market real yield through 2025 is 1.95%. Had we delivered a 'normal' real yield of 2% in the 10yr, the nominal yield would have peppered 5% through 2025.
Even more unusual is that the low delivered real yield for 2025 incorporates (apparently) a suitable discount in Treasuries to account for the 6% fiscal deficit and troubling medium-term debt dynamics. It shows up in the 10yr tenor in the guise of a 40bp spread over SOFR. The average has been 50bp in the past year – a pure cost paid for deficit elevation.
So, many questions for 2026. As the Fed cuts some more, where does that leave the 10yr yield and the shape of the curve? And what about the aforementioned swap spreads and the likely deviation between SOFR market rates and Treasury yields?
To set the scene for 2026, we have to start with SOFR (AAA curve)A starting point is SOFR, as this is the purest version of market rates; impliedly 'AAA-rated', as it's the risk-free curve. The difference between this and Treasuries is that SOFR does not care about issuance pressure (the credit element that affects Treasuries). But SOFR is impacted by“everything else” that determines market rates.
The big issue right now is the tameness of 10yr SOFR – it's at 3.7%. That's a 70bp real rate (versus contemporaneous core inflation of 3%), which is low. A simple theoretical ask is to have a minimum real rate of 1%, implying a 4% 10yr SOFR rate, based on the concept of neutrality backed out from historical averages.
Historical averages back to the 1990s tend to back out a 10yr rate with a 4% handle. A 10yr neutral rate at about this level also makes theoretical sense, as it gels with normal growth plus inflation circumstances. The 10yr SOFR rate can, of course, trade below 4%, but would need to be justified by super-tame inflation circumstances, which we don't have.
In fact, we see greater tariff impact on prices as a theme through the first half of 2026, with inflation trending higher in the 3% to 3.5% range. But as we move further into the year, inflation is tamed by weaker housing market dynamics, pulling it back below 3% through the second half of 2026 (sub-2.5% is possible).
A key background driver is the rise in Japanese and eurozone market rates. As these shift higher, there is a relative value push on US market rates, particularly for longer tenors. The front end of the curve is heavily influenced by domestic factors and the funds rate. But longer tenors are far more responsive to international rate circumstances.
This leaves us with a dominant expectation for the 10yr SOFR rate to head in the direction of 4% through the first half of 2026. Even at 4% it's not particularly high. It could and should pop above 4% for a bit. Then, through the second half of 2026, the tendency for longer tenor rates is expected to ease back down again, but to remain above where they are today.
Here's how we see SOFR rates evolving through 2026 (%)Arrows illustrate differences versus December 2025
Source: Macrobond, ING estimates Anticipate cheapening in the belly as the curve stretches steeper
So, let's map out the SOFR curve, viewing it as an extrapolation of the Fed funds rate into the future. The starting point is the floor for the funds rate in the current cycle. We identify this as 3% to 3.25% – effectively a move to a neutral funds rate. We expect to get there by the second quarter of 2026, and then the Fed holds.
Once we get there, and assuming the market believes that to be the bottom, there should be a natural tendency for steepening to take hold in money markets. The rationale here is a discount for a higher funds rate in the future, on a theory that if the funds rate has floored, logically the next move must be up. History corroborates this type of leaning as typical.
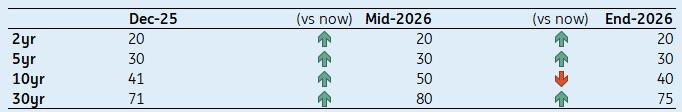
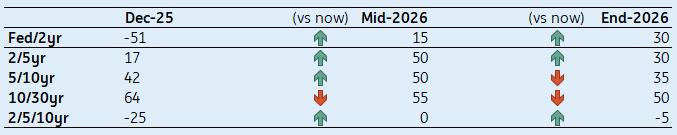
Whether the Fed actually hikes rates is not the point; the market will tend to adopt an upward-sloping tendency on money markets regardless. This will be reflected right along the 2/5yr segment, with the 5yr cheapening up to the 2yr. Currently, the spread from 2yr SOFR to 5yr SOFR is a mere 5bp. That can easily get to 25+bp; mostly a higher 5yr rate.
If so, that pushes the 5yr rate up to where the 10yr SOFR rate currently is (3.7% area). As alluded to above, we think the 10yr SOFR rate is quite tame at 3.7%. We see natural upside to the 3.75% to 4% area. And even that is not particularly elevated. It's in fact in tune with what we'd call a neutral curve (75bp-100bp), referenced against a neutral funds rate.
The 30yr SOFR rate is currently at 4.1% and will have a tendency to head for 4.25%, implying flattening on the 10/30yr segment. Effectively, what's happening here is the belly of the curve is cheapening up versus the wings as the curve pivots steeper from the back end, with most of the steepening on the 2/5yr segment and least on the 10/30yr.
Here's how we see Treasury spreads to SOFR evolve through 2026 (bp)Arrows illustrate differences versus December 2025
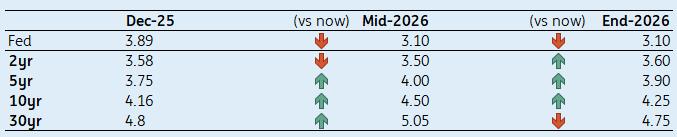
Source: Macrobond, ING estimates For Treasuries, that pitches the 10yr in the 4.25% to 4.5% area
The SOFR curve maps out the true market rates profile, and the Treasury curve is then pitched as a spread relative to this. This classic asset swap spread is currently a 'credit spread' to reflect the cost of poor debt dynamics. The translation of that into Treasury yields comes through supply pressure, theoretically cheapening Treasuries versus SOFR.
And here we need to acknowledge that Treasury Secretary Bessent is keen not to place supply pressure on the coupon curve. For 2026, we anticipate that coupon issuance sizes will remain unchanged relative to 2025, as the bills programme continues to cover any morph higher in issuance pressure. That helps minimise longer tenor spread pressure.
At the same time, deficit pressure remains a growing problem that longer dates need to discount as a 'down the line' problem, one that's not going away. In sum, we anticipate that Treasury spreads over SOFR will come under re-widening pressure in 2026. Specifically, in the 10yr, the fiscal deficit penalty should be more; conservatively, we get back to 50bp.
We can see upside to the 10yr yield dominating through the first half of 2026, as we see more tariff impact on prices than we've seen so far. That's when the 4.5% number comes into focus. But as we progress through 2026, we'd see the 10yr yield then drifting back down to the 4.25% area, as inflation gets tamed by the weaker housing market dynamic.
We end up with a scenario where the 2yr yield, now at 3.55%, is likely to hold in the 3.5% area. But it will be under some pressure to trade in the 3.5% to 3.75% area as the money market steepening trend takes hold by the second half of 2026. The 30yr yield gets back up to 5%, and likely pops above as a theme for the first half of 2026.
Here's how we see Treasury yields evolving through 2026 (%)Arrows illustrate differences versus December 2025
Source: Macrobond, ING estimates Here's how we see Treasury curve segments evolve through 2026 (bp)
Arrows illustrate differences versus December 2025
Source: Macrobond, ING estimates Risk Bands: Impact of bigger Fed cuts than anticipated on the 10yr
Here we examine two scenarios, both premised on the notion that the Fed does not stop at 'around 3%', but rather gets the funds rate down to 'around 2%'. There are two ways to get there. The first way is with justification (positive for 10yr Treasuries), while the second is without justification (negative for 10yr Treasuries).
The Fed cuts 'with justification' scenario sees the US 10yr yield heading towards 3%
The 'with justification' scenario is one where the macro picture morphs to severe corrections in the tech and housing markets, squeezing confidence and spending and pressuring the economy into a recessionary tendency, necessitating Fed cuts to 2%. This would be at 1% to 1.5% below what we consider neutral (3% to 3.5%).
In this non-inflationary scenario, the US 10yr yield is quickly pulled structurally below 4%, and has the potential to get all the way down to 3%. We'd have a central tendency in the 3% to 3.5% area on the assumption that the Fed is actually done cutting at 2% and there is an ambition for the next move then to be a hike, even if eventually.
The Fed cuts 'without justification' scenario sees the US 10yr yield heading to 5%
The“without justification scenario” is where a Trump-administration-impacted Fed swings super dovish, and executes rate cuts far in excess of what's required in an attempt to juice the economy in good time for the mid-term elections. While a positive comes from higher tax receipts, the bigger negative is a rise in inflation risks. Add to that the notion that the Fed is doing things it really should not be doing, tarnishing credibility.
While Treasuries love rate cuts, they won't like them much given this cocktail. Here, there is a material risk that things finally begin to unravel for longer tenors, with the 10yr yield hitting 5%, and the 30yr risks hitting 6%. In fact, this is a cocktail that could necessitate yield curve control, taking policy onto a very troubling trajectory.
We prefer our base view, as it's the most likely. It's also, by definition, more likely than either of these alternative parallel universes, both of which are quite troubling.

Legal Disclaimer:
MENAFN provides the
information “as is” without warranty of any kind. We do not accept
any responsibility or liability for the accuracy, content, images,
videos, licenses, completeness, legality, or reliability of the information
contained in this article. If you have any complaints or copyright
issues related to this article, kindly contact the provider above.
Most popular stories
Market Research

More Story


Comments
No comment