Tuesday, 02 January 2024 12:17 GMT

XAU/USD Analysis 18/11: Selling Pressure (Chart)


(MENAFN- Daily Forex) Today's Gold Analysis Overview:
  • The overall of Gold Trend: Subject to a Bearish Technical Correction.
  • Today's Gold Support Points: $3990 – $3945 – $3880 per ounce.
  • Today's Gold Resistance Points: $4070 – $4130 – $4200 per ounce

Today's Gold Trading Signals:
  • Sell Gold from the resistance level of $4115 with a target of $3980 and a stop-loss at $4170.
  • Buy Gold from the support level of $3960 with a target of $4150 and a stop-loss at $3920.
Technical Analysis of Gold Price (XAU/USD) Today:

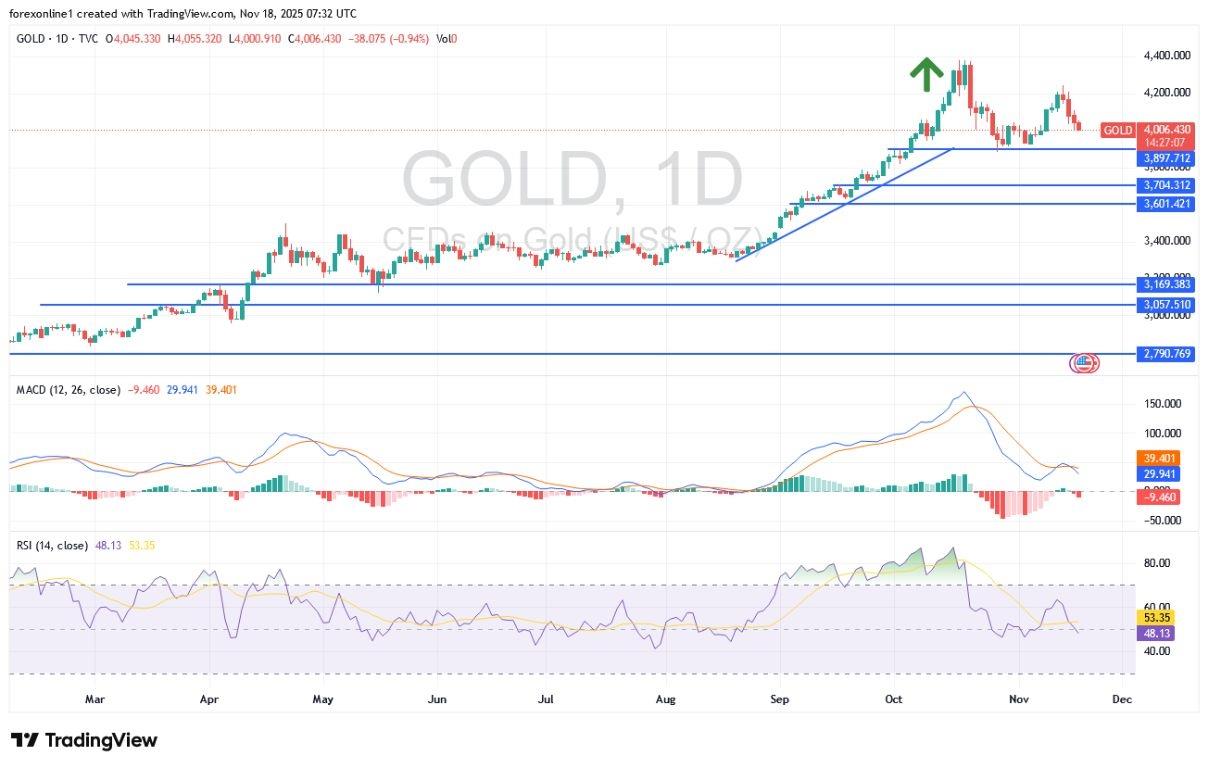
For three consecutive trading sessions, spot gold prices have been incurring losses due to new selling transactions, initiated from the $4245 per ounce resistance level last Thursday. Losses extended to the $4006 per ounce support level, and according to gold trading company platforms, the gold index is stable around the $4022 per ounce level at the time of writing this analysis. Commodity market experts believe that both the gold and stock markets are under pressure as investors assess the probability of a US interest rate cut in December.

According to gold analysts' forecasts, the probability of a "December de-risking" is increasing, affecting the prices of precious metals, which recorded new record highs throughout the year. Analysts believe that there may still be more upside ahead. Experts predicted continued volatility in metal prices but maintained an upward trading bias. Important US economic data this week will directly affect market expectations for the future of US interest rate policy. It is known that lower interest rates typically enhance the attractiveness of non-yielding bullion prices, while a weaker Dollar increases gold's appeal to international buyers.

Top Forex Brokers1 Get Started 74% of retail CFD accounts lose money

Expectations for US monetary policy easing declined following cautious statements from Federal Reserve officials, while the six-week US government shutdown delayed the release of key employment and inflation data, making policymakers more hesitant to take any further steps.

The bullish gold scenario remains valid with spot gold prices stabilizing around and above the psychological level of $4000 per ounce. The recent gold losses have pushed the 14-day Relative Strength Index (RSI) only to the neutral line on the daily chart, while the MACD indicator lines are currently leaning downward. The return of bull dominance in gold trading requires a move toward the resistance levels of $4120 and $4200 per ounce again. Conversely, gold investors may remain in a waiting mode for new buying opportunities. Gold trading will remain cautious until the market reacts to the important US economic releases following the end of the longest US government shutdown in history Advice:

Dear TradersUp trader, we still recommend following a strategy of buying gold on strong dips, but without excessive risk, and diversifying your investment portfolio.

MENAFN18112025000131011023ID1110362573


Daily Forex

Legal Disclaimer:
MENAFN provides the information “as is” without warranty of any kind. We do not accept any responsibility or liability for the accuracy, content, images, videos, licenses, completeness, legality, or reliability of the information contained in this article. If you have any complaints or copyright issues related to this article, kindly contact the provider above.

Search