


403
Sorry!!
Error! We're sorry, but the page you were looking for doesn't exist.

SEI Shows Early Signs Of Recovery After TD Sequential Buy Signal And Technical Momentum Shift
(MENAFN- Crypto Breaking) SEI token has shown early signs of price stabilization after recent declines, supported by a TD Sequential buy signal and improving short-term technical indicators. The asset is trading near the $0.16 mark, hinting that a potential bottom may be forming.TD Sequential Indicator Suggests Downtrend Exhaustion
Crypto assets are highly volatile. Your capital is at risk. Don't invest unless you're prepared to lose all the money you invest.
A chart shared by market analyst Ali Martinez on X indicated that the TD Sequential indicator has flashed a buy signal on SEI's daily timeframe. This tool, developed by Tom DeMark, is used to identify trend exhaustion and potential reversal points after extended market movements.
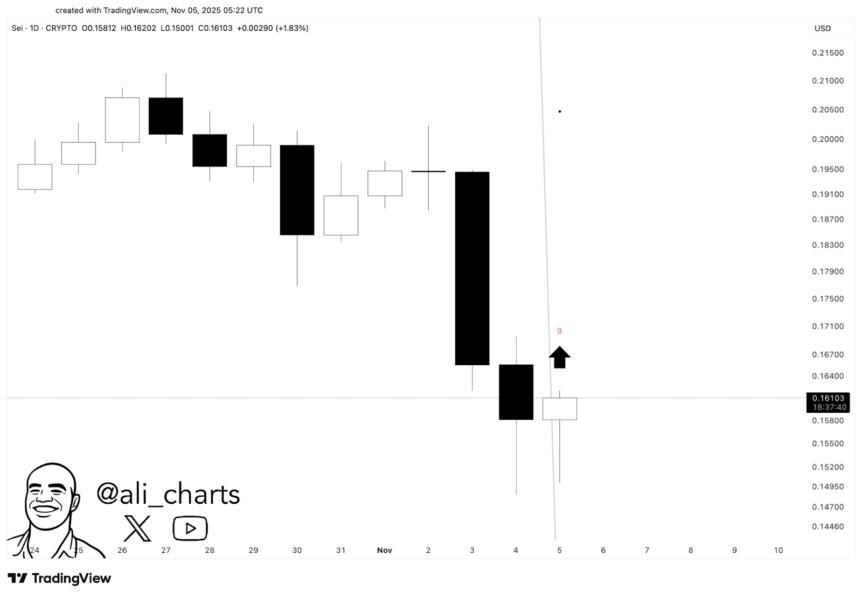
Source: X
The pattern on SEI's daily chart shows consecutive bearish candles followed by a smaller bullish one, signaling that selling pressure may have eased. The buy signal appeared near the $0.1600–$0.1620 zone, which now acts as a critical support level. Resistance levels are located near $0.1750, $0.1850, and $0.1950. A sustained move above $0.20 could confirm the start of a short-term recovery.
Short-Term Momentum Improves on Technical IndicatorsOn the 4-hour SEI/USDT chart from Binance, SEI trades around $0.1637, posting a 1.17% gain in the last session. Price data shows the token forming a potential support base near $0.16 after weeks of lower highs and lower lows.
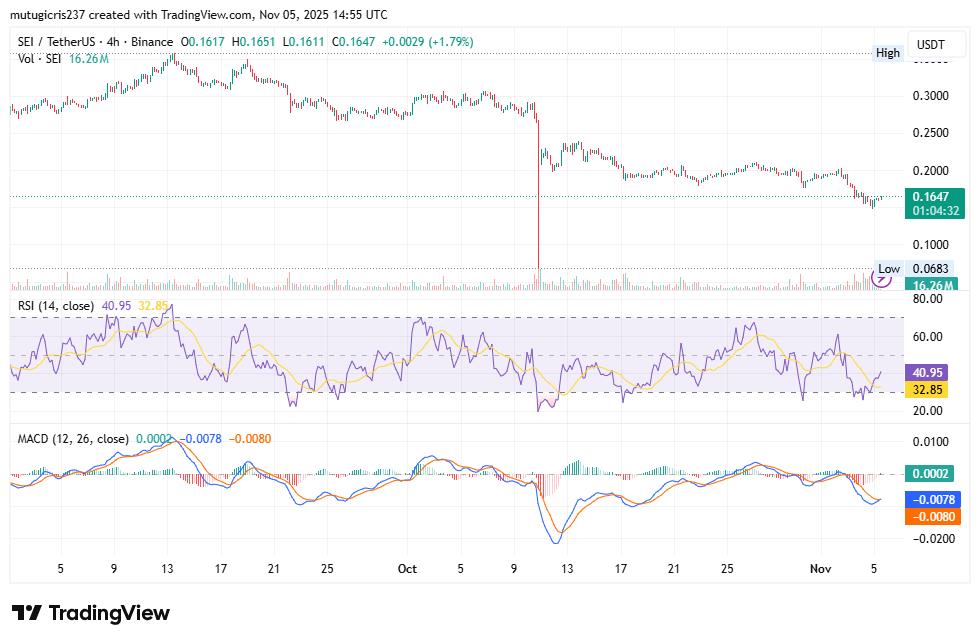
Source: TradingView
The Relative Strength Index (RSI) stands at 39.74, recovering from oversold territory and suggesting that selling pressure has eased. The MACD has shown a recent bullish crossover, with the MACD line moving above the signal line, often interpreted as an early positive shift in market momentum.
Market Stability and Future Price ScenariosAccording to CoinMarketCap data, SEI trades at $0.1632, up 2.71% daily. It has a market capitalization of $1.02 billion and the fully diluted valuation of about $1.63 billion. The trading volume was recorded at $160.6 million daily, which is a sign of liquidity, even though there is a slight decrease compared to the prior trading session.
With SEI continuing to support above $0.16, the near future would see a price test at $0.17 to $0.18. A break above $0.18 can reinforce the bullish formation, whereas a fall below $0.15 would denote fresh weakness. The current data indicates that the token is in a stabilization stage, and there are first indicators of interest to buy back.
Crypto Investing Risk WarningCrypto assets are highly volatile. Your capital is at risk. Don't invest unless you're prepared to lose all the money you invest.

Legal Disclaimer:
MENAFN provides the
information “as is” without warranty of any kind. We do not accept
any responsibility or liability for the accuracy, content, images,
videos, licenses, completeness, legality, or reliability of the information
contained in this article. If you have any complaints or copyright
issues related to this article, kindly contact the provider above.
Most popular stories
Market Research

More Story


Comments
No comment