403
Sorry!!
Error! We're sorry, but the page you were looking for doesn't exist.
GBP/USD Forex Signal 20/10: Bearish Outlook Ahead (Chart)
(MENAFN- Daily Forex) Bearish view
- Sell the GBP/USD pair and set a take-profit at 1.3300. Add a stop-loss at 1.3550. Timeline: 1-2 days.
- Buy the GBP/USD pair and set a take-profit at 1.3550. Add a stop-loss at 1.3300.
The GBP/USD exchange rate will also react to the upcoming US inflation data on Friday. A hotter-than-expected report will complicate the Federal Reserve interest rate outlook by making it hard to cut interest rates.
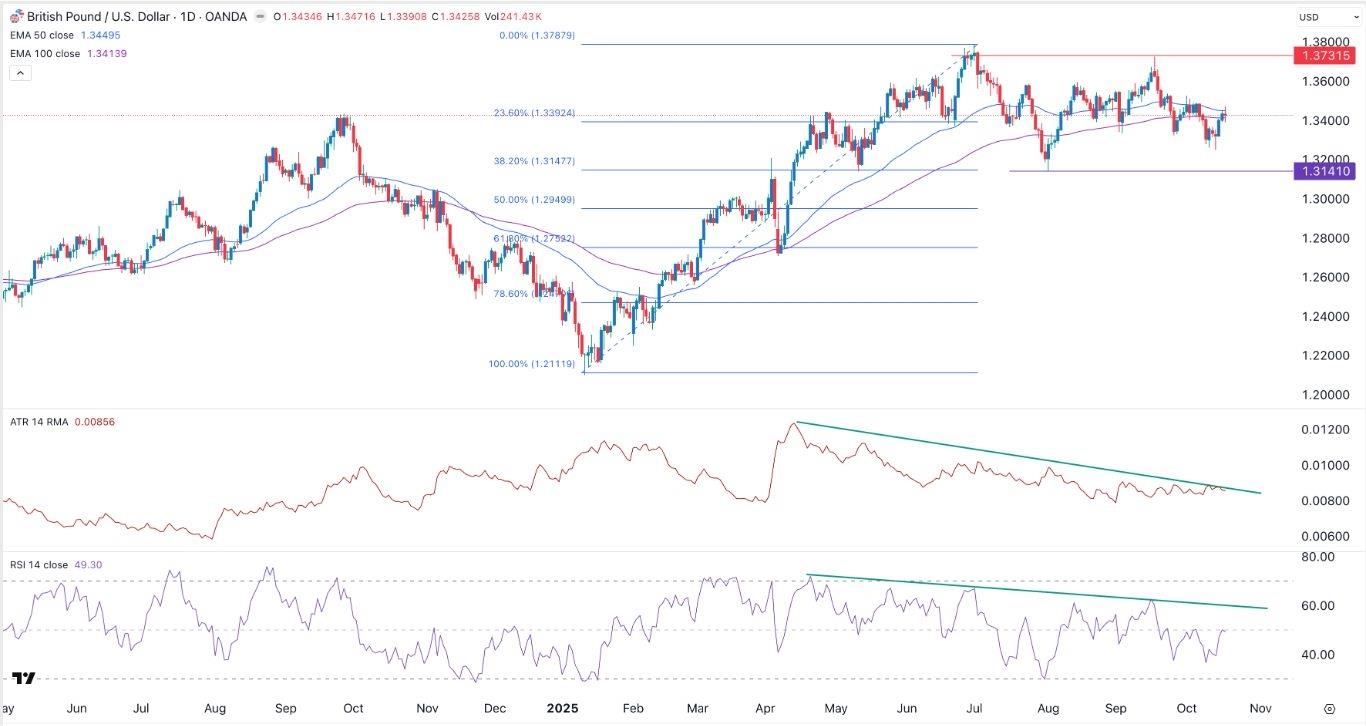
EURUSD Chart by TradingViewGBP/USD Technical AnalysisThe daily timeframe chart shows that the GBP/USD exchange rate formed a double-top pattern at 1.3731 and a neckline at 1.3140, its lowest level in July and the 38.2% Fibonacci Retracement point.It is consolidating at the 50-day and 100-day Exponential Moving Averages (EMA). At the same time, the Relative Strength Index (RSI) and the Average True Range (ATR) indicators have formed a bearish divergence pattern.The pair has also formed a small head-and-shoulders pattern, which is a common bearish reversal pattern. Therefore, it will likely have a strong bearish breakout potentially to the key support at 1.3141.Ready to trade our free trading signals? We've made a list of the best UK forex brokers worth using.
Legal Disclaimer:
MENAFN provides the
information “as is” without warranty of any kind. We do not accept
any responsibility or liability for the accuracy, content, images,
videos, licenses, completeness, legality, or reliability of the information
contained in this article. If you have any complaints or copyright
issues related to this article, kindly contact the provider above.
Most popular stories
Market Research
- Thinkmarkets Adds Synthetic Indices To Its Product Offering
- Ethereum Startup Agoralend Opens Fresh Fundraise After Oversubscribed $300,000 Round.
- KOR Closes Series B Funding To Accelerate Global Growth
- Wise Wolves Corporation Launches Unified Brand To Power The Next Era Of Cross-Border Finance
- Lombard And Story Partner To Revolutionize Creator Economy Via Bitcoin-Backed Infrastructure
- FBS AI Assistant Helps Traders Skip Market Noise And Focus On Strategy


Comments
No comment