


403
Sorry!!
Error! We're sorry, but the page you were looking for doesn't exist.

How Low Will Prices Drop Next? Surprising Market Predictions
(MENAFN- Crypto Breaking) Recent market activity suggests that XRP , the popular cryptocurrency, is facing renewed pressure after multiple attempts to exceed the $3 mark. Despite brief surges above this psychological threshold, the token has experienced consistent rejections, hinting at a potential corrective phase. Traders are closely monitoring technical signals that could indicate a further decline in XRP's price amid mounting volatility and liquidity considerations within the broader crypto markets.
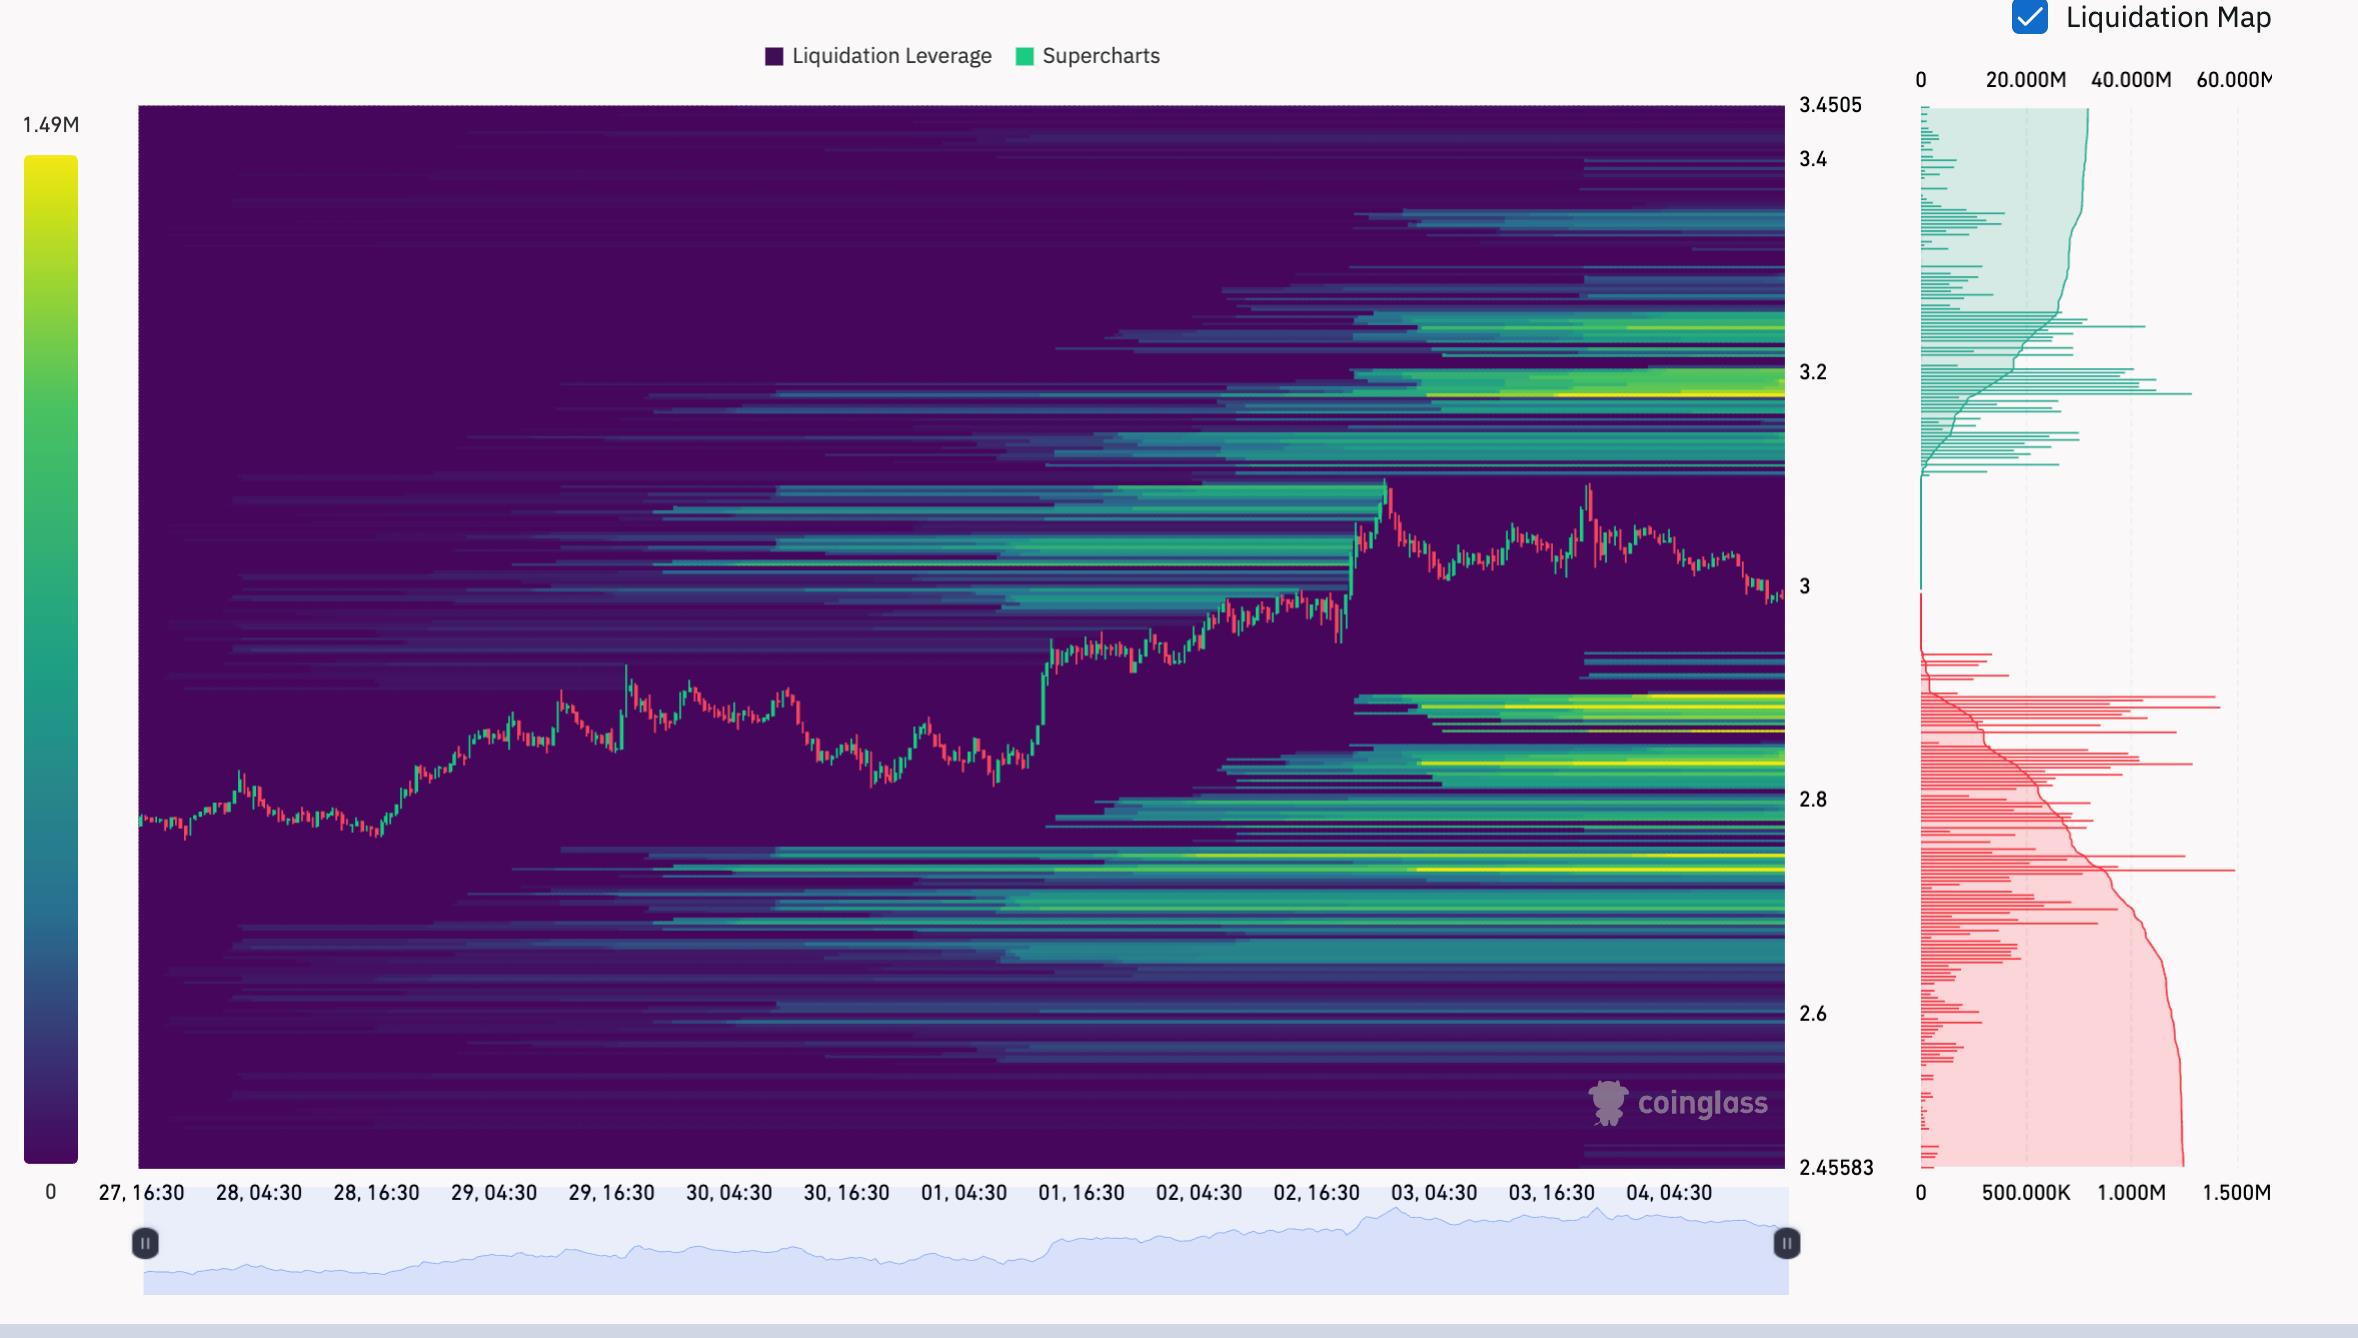
XRP/USDT liquidation heatmap (1-week). Source: CoinGlass/HyperLiquid
Crypto assets are highly volatile. Your capital is at risk. Don't invest unless you're prepared to lose all the money you invest.
- XRP has repeatedly attempted to break above $3 since its surge in November 2024 but has faced persistent rejections. Technical analysis indicates a possible 15% correction, driven by fractal patterns resembling previous downturns. A significant $500 million long squeeze could accelerate a price decline toward $2.60 if key support levels are breached. Market liquidity clusters suggest strong resistance at $3.18-$3.40 and substantial liquidation levels between $2.73 and $2.89.
Despite multiple bullish pushes, XRP has struggled to maintain sustained gains above the $3 threshold. On Saturday, the token's price dipped once again below this critical support, aligning with its 200-period four-hour exponential moving average (EMA). The recurring inability to hold above this level signals possible weakness ahead, prompting investors to prepare for potential downside movements.
XRP chart fractal puts 15% correction in playTechnical analysis points to a bearish fractal pattern similar to those seen earlier this year, which could result in a roughly 15% correction to approximately $2.60. This pattern is characterized by the formation of a rounded top followed by a consolidation phase within a bearish flag-structures often preceding sharp declines. Historically, such formations led to declines towards the $2.70 region, reinforcing the possibility of similar price action unfolding again.
XRP/USD four-hour price chart. Source: TradingViewCurrently, XRP is consolidating within a bearish setup, with its relative strength index (RSI) correcting from overbought levels above 70. There remains room for the RSI to decline toward oversold conditions below 30, heightening the risk of further downside if selling pressure intensifies.
Should XRP break below its flag support at around $2.93, a swift move toward $2.60 could occur, aligned with its 200-day EMA, highlighting significant support levels for traders to watch. Conversely, if bulls manage to defend key support levels at the 20- or 50-day EMAs, a rebound toward $3 could restore bullish momentum.
$500 million long squeeze can fuel the XRP sell-offXRP's current trading zone sits between two major liquidity clusters, as demonstrated by data from CoinGlass. The area just above $3 features large concentrations of long liquidation levels, notably between $3.18 and $3.40. For example, at $3.18, short positions totaling more than $33 million could be triggered to cover if prices rise again, potentially fueling a short-term rally.
XRP/USDT liquidation heatmap (1-week). Source: CoinGlass/HyperLiquid
On the downside, over $500 million worth of liquidity sits between $2.73 and $2.89, suggesting that a decisive move below $3 may trigger a cascade of long liquidations, pushing prices lower toward these support levels. Alternatively, maintaining above $3 could lead to a short-term stop-run toward $3.20–$3.40, presenting potential opportunities for traders to capitalize on volatility in the volatile cryptocurrency markets.
This article does not contain investment advice or recommendations. Every investment and trading move involves risk, and readers should conduct their own research when making a decision.
Crypto Investing Risk WarningCrypto assets are highly volatile. Your capital is at risk. Don't invest unless you're prepared to lose all the money you invest.

Legal Disclaimer:
MENAFN provides the
information “as is” without warranty of any kind. We do not accept
any responsibility or liability for the accuracy, content, images,
videos, licenses, completeness, legality, or reliability of the information
contained in this article. If you have any complaints or copyright
issues related to this article, kindly contact the provider above.
Most popular stories
Market Research

More Story


Comments
No comment