403
Sorry!!
Error! We're sorry, but the page you were looking for doesn't exist.
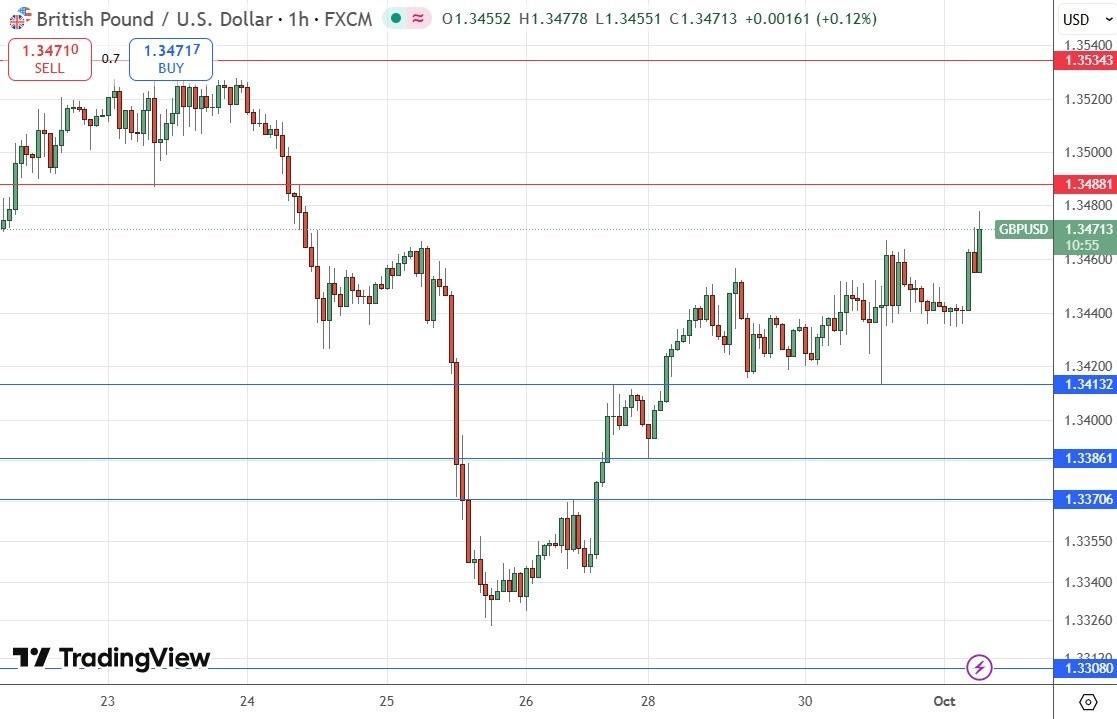
GBP/USD Signal 01/10: Strong Buying Above $1.3413 (Chart)
(MENAFN- Daily Forex) My previous GBP/USD signal on 10th September produced a profitable long trade from the bullish bounce off the support level which I had identified at $1.3519, with a natural take profit signal from the bearish reversal at $1.3559.Today's GBP/USD SignalsRisk 0.75%.Trades must be taken prior to 5pm Tokyo time Thursday Trade Ideas
- Go long following a bullish price action reversal on the 1H1 time frame H1H1H1 timeframe immediately upon the next touch of $1.3413, $1.3386, or $1.3371.
- Place the stop loss 1 pip below the local swing low. Move the stop loss to break even once the trade is 25 pips in profit. Remove 50% of the position as profit when the price reaches 25 pips in profit and leave the remainder of the position to ride.
- Go short following a bearish price action reversal on the 1H1 time frame H1H1H1 timeframe immediately upon the next touch of $1.3488, 1.3534, or $1.3561.
- Place the stop loss 1 pip above the local swing high. Move the stop loss to break even once the trade is 25 pips in profit. Remove 50% of the position as profit when the price reaches 25 pips in profit and leave the remainder of the position to ride.

Legal Disclaimer:
MENAFN provides the
information “as is” without warranty of any kind. We do not accept
any responsibility or liability for the accuracy, content, images,
videos, licenses, completeness, legality, or reliability of the information
contained in this article. If you have any complaints or copyright
issues related to this article, kindly contact the provider above.
Most popular stories
Market Research

- Financewire And Tipranks Partner To Redefine Financial News Distribution
- Ethereum-Based Defi Crypto Mutuum Finance (MUTM) Reaches 50% Completion In Phase 6
- Stonehaven Circle Marks 13Th Anniversary With Hadrian Colwyn Leading Calvio Ailegacyx Innovation
- Citadel Launches Suiball, The First Sui-Native Hardware Wallet
- Motif AI Enters Phase Two Of Its Growth Cycle
- Dubai At The Centre Of Global Finance: Forex Expo 2025 Redefines The Trading Landscape


Comments
No comment