403
Sorry!!
Error! We're sorry, but the page you were looking for doesn't exist.
BTC/USD Signal 01/10: Bitcoin Price Rallies (Chart)
(MENAFN- Daily Forex) Bullish view
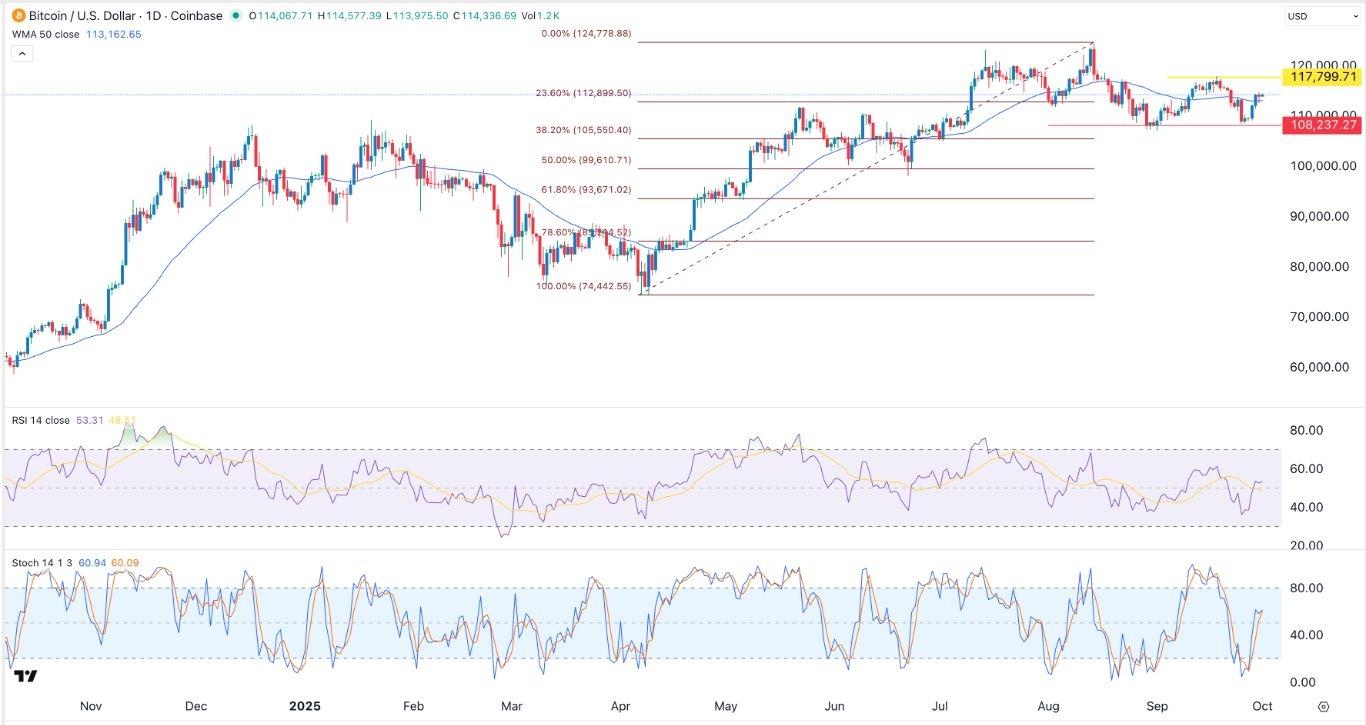
- Buy the BTC/USD pair and set a take-profit at 118,750. Add a stop-loss at 110,000. Timeline: 1-2 days.
- Sell the BTC/USD pair and set a take-profit at 110,000. Add a stop-loss at 118,750.
The next key catalyst for the BTC/USD pair will be the upcoming ADP jobs report. A weak jobs report will be bullish for Bitcoin as it will boost the odds of Fed cuts.
EURUSD Chart by TradingViewBTC/USD Technical AnalysisThe daily timeframe chart shows that the BTC/USD pair has rebounded in the past few days. It moved from a low of 108,237 on September 25 to 114,500.Bitcoin price has formed a double-bottom pattern whose neckline is at $117,800. Also, it moved above the 50-day Exponential Moving Average (EMA) and the 23.6% Fibonacci Retracement level.The BTC/USD pair has jumped above the Major S/R Pivot Point of the Murrey Math Lines at 112,500. Therefore, the most likely scenario is where the pair will rebound and initially hit the neckline at $117,800.A move above that resistance will point to more gains, potentially to the psychological point at 120,000. On the other hand, a drop below the support at 112,000 will invalidate the bullish outlook and point to more downside.Ready to trade our free Forex signals ? Here are the best MT4 crypto brokers to choose from.
Legal Disclaimer:
MENAFN provides the
information “as is” without warranty of any kind. We do not accept
any responsibility or liability for the accuracy, content, images,
videos, licenses, completeness, legality, or reliability of the information
contained in this article. If you have any complaints or copyright
issues related to this article, kindly contact the provider above.


Comments
No comment