DAX 40 Weakens, Copper Hits 2-Month High As AUD/USD Hovers Above Support.
Wall Street closed lower for a second session as investors took profits after Federal Reserve (Fed) Chair Jerome Powell warned of stretched valuations, with materials stocks leading declines following a 17% drop in Freeport-McMoRan on force majeure at its Grasberg mine.
Energy outperformed, rising 1.2% as crude hit a 3-week high on falling US inventories, while Lithium Americas nearly doubled on reports of potential US government investment and loans.
Oracle slipped on bond sale plans, Micron declined after earnings, though US new home sales surged 20.5% in August.
Overseas, Japan's Nikkei 225 gained slightly on dip-buying, but European markets looked set for a flat start amid valuation concerns and cautious Fed signals.
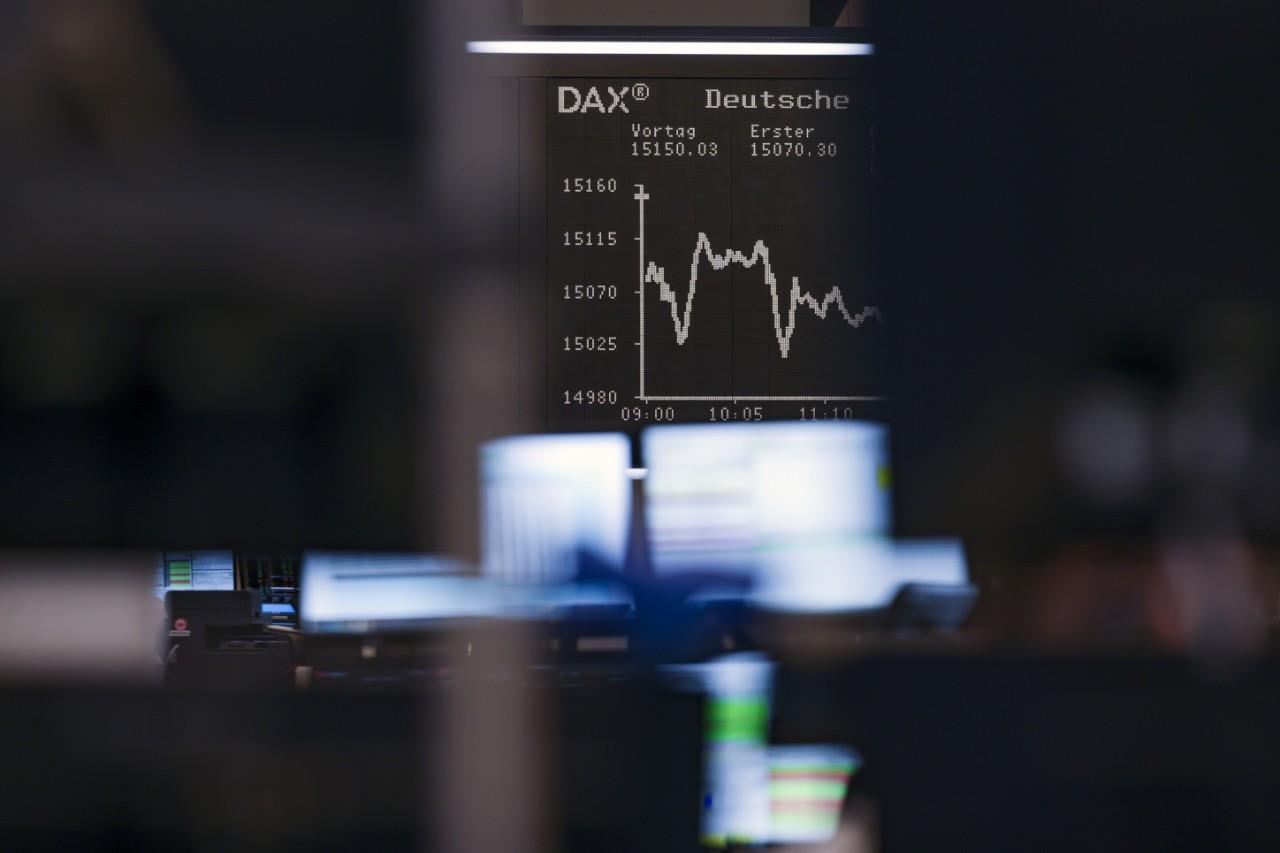
DAX 40 remains under pressureThe DAX 40's recovery from its 23,285 mid-September low seems to have stalled in the 23,700 region with renewed downside pressure being in play while it remains below its 19 September high at 23,785.
A drop through Wednesday's 23,500 low would be expected to engage the early September low at 23,483.
DAX 40 daily candlestick chart Source: TradingView AUD/USD hovers above supportAUD/USD remains above this week's lows at $0.6575 and is trying to head back up towards Wednesday's high at $0.6628. It would need to be exceeded for the 13-month high at $0.6707 to be back in view.
Failure at $0.6575 on a daily chart closing basis may lead to the $0.6568-to-$6564 minor support zone being revisited. Further down meanders the 55-day simple moving average (SMA) at $0.6538.
AUD/USD daily candlestick chart Source: TradingView Copper rallies to 2-month highThe copper price surged higher on Wednesday and hit a 2-month high at $4.8893, a rise above which would put the 22 April high at $4.9328 and, more importantly, the $4.9635 late April peak on the map.
Support may be found along the 200-day SMA at $4.7979.
Copper daily candlestick chart Source: TradingViewThis information has been prepared by IG, a trading name of IG Markets Limited. In addition to the disclaimer below, the material on this page does not contain a record of our trading prices, or an offer of, or solicitation for, a transaction in any financial instrument. IG accepts no responsibility for any use that may be made of these comments and for any consequences that result. No representation or warranty is given as to the accuracy or completeness of this information. Consequently any person acting on it does so entirely at their own risk. Any research provided does not have regard to the specific investment objectives, financial situation and needs of any specific person who may receive it. It has not been prepared in accordance with legal requirements designed to promote the independence of investment research and as such is considered to be a marketing communication. Although we are not specifically constrained from dealing ahead of our recommendations we do not seek to take advantage of them before they are provided to our clients. See full non-independent research disclaimer and quarterly summary .

Legal Disclaimer:
MENAFN provides the
information “as is” without warranty of any kind. We do not accept
any responsibility or liability for the accuracy, content, images,
videos, licenses, completeness, legality, or reliability of the information
contained in this article. If you have any complaints or copyright
issues related to this article, kindly contact the provider above.
Most popular stories
Market Research

- Kintsu Launches Shype On Hyperliquid
- Barunson, Studio Behind Parasite, To Launch Nplug IP Remixing Platform On Story And Bring Flagship IP Onchain
- Moonbirds And Azuki IP Coming To Verse8 As AI-Native Game Platform Integrates With Story
- Leverage Shares Launches First 3X Single-Stock Etps On HOOD, HIMS, UNH And Others
- Alchemy Markets Launches Tradingview Integration For Direct Chart-Based Trading
- Dexari Unveils $1M Cash Prize Trading Competition


Comments
No comment