
How Pros Pair Tradingview Indicators With An AI Chart Analyzer
Markets reward context + confluence over lone-wolf indicators. What do we do at Zeiierman Trading to reap the reward? Our go-to strategy is to pair a structured, unbiased read from the AI Chart Analyzer with some of our market- and trend-focused scripts (indicators) on TradingView.
The AI provides an overview of market“vitals,” including Trend Strength, Momentum, and Volatility, along with a clear breakdown. Finally, you follow it up with good ol' fashioned, manual technical analysis to confirm the trade before entering.
Before we get into the“steps” of this strategy, let's quickly gloss over the tools you'll need to follow my workflow. Don't worry, you don't need a spaceship. Just a clean workflow and the right tools.
- Charts: We use TradingView because that's where our indicators lie. For the AI Analyzer, at least, you can use any charting platform you prefer. AI Chart Analyzer: We use the Zeiierman AI Chart Analyzer It's free for upto 5 charts per month, so you can get access without purchasing our subscription. Indicators: For proper confluence and confirmation, I recommend our premium indicators such as the SMC toolkit, Liquidity Levels, and FVG & Volume tools. However, we have a plethora of indicators directly on TradingView that you can use without having to sign up. Trading Journal: A place (a notebook or digital notes) where we do strategy.
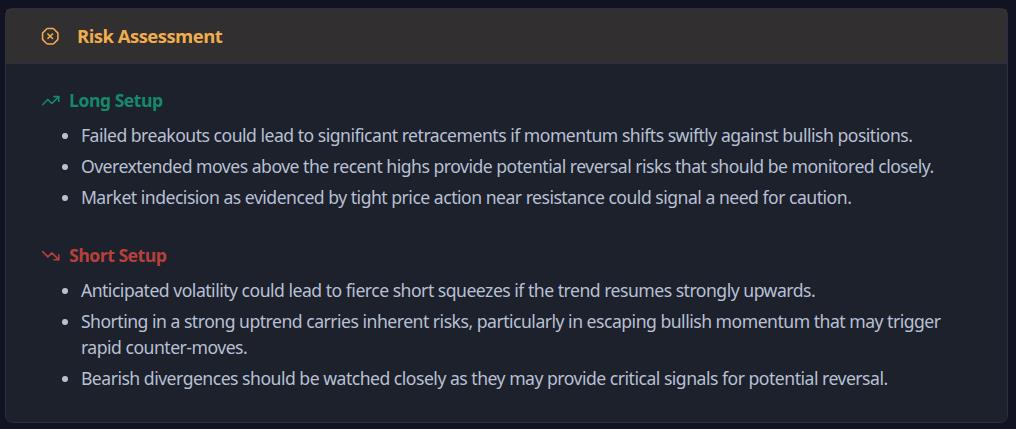
📌 My Risk Rule: Even perfect confluence can fail around major news, thin liquidity, or micro-TF noise. If the Risk Assessment tab flags obvious hazards, respect them. Capital first, ego second.
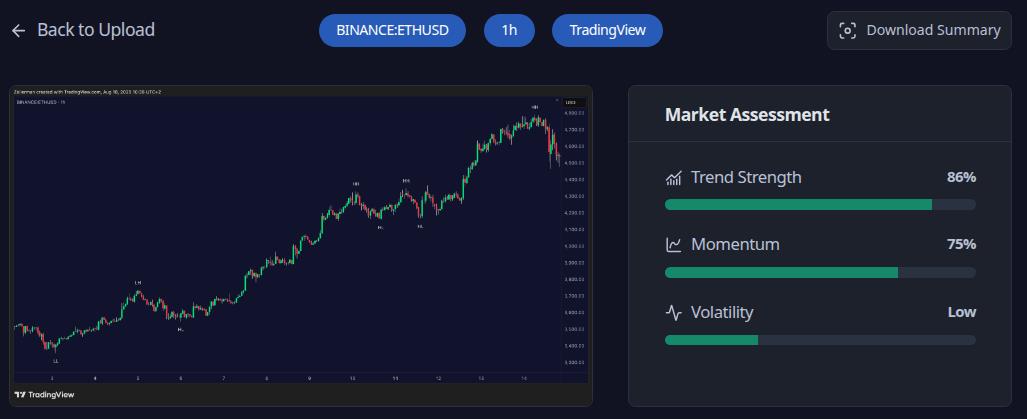
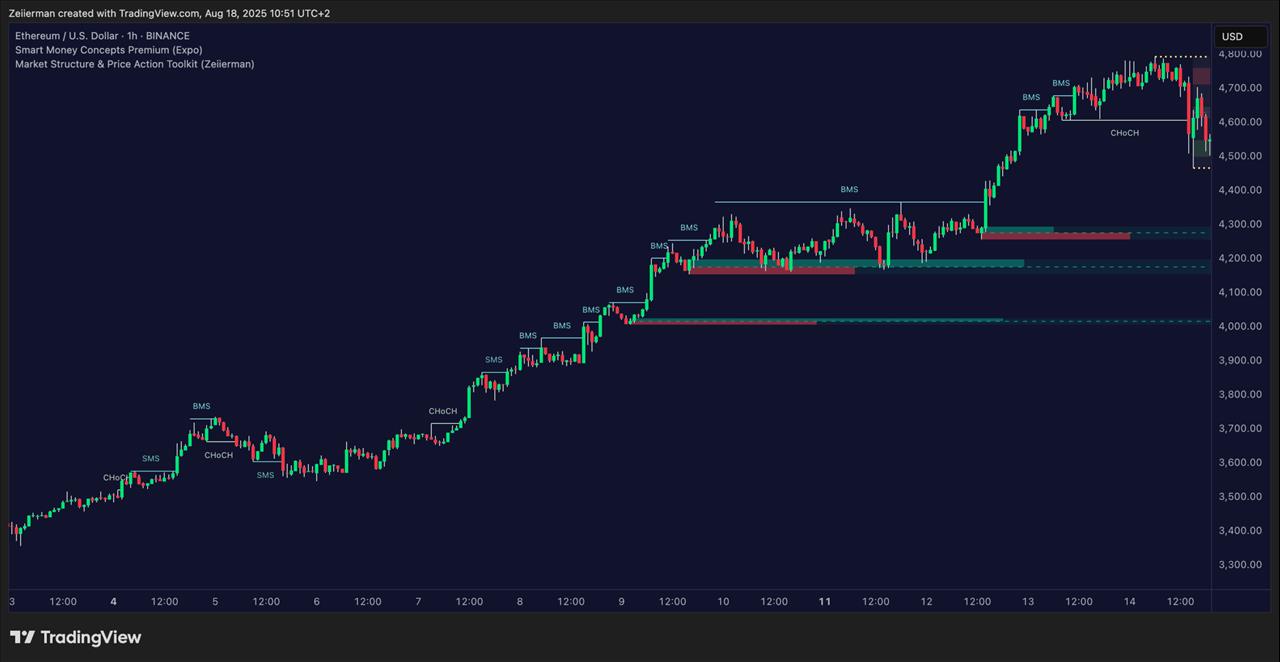
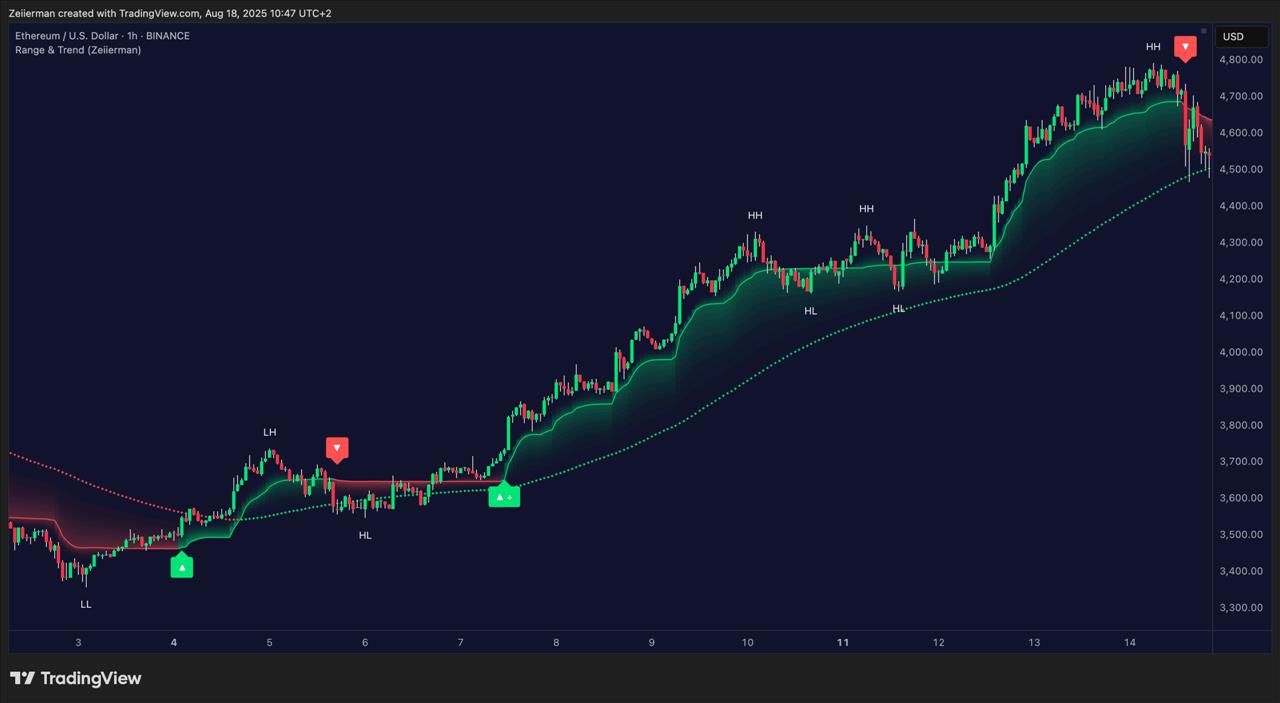
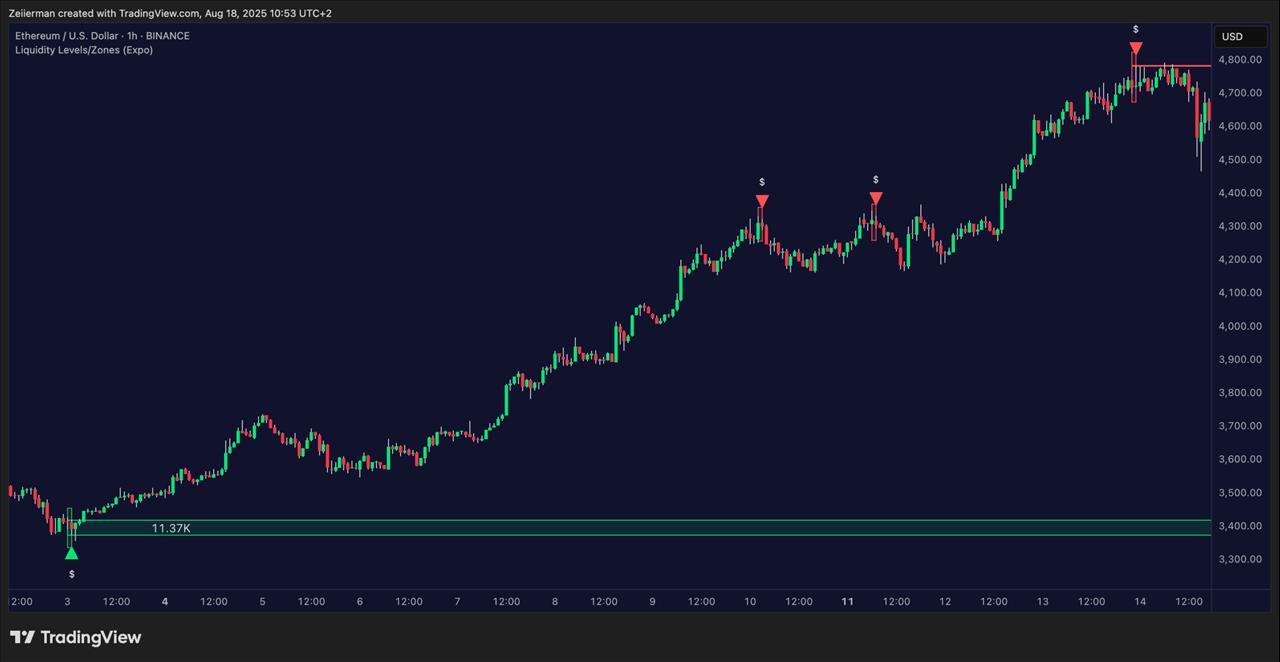
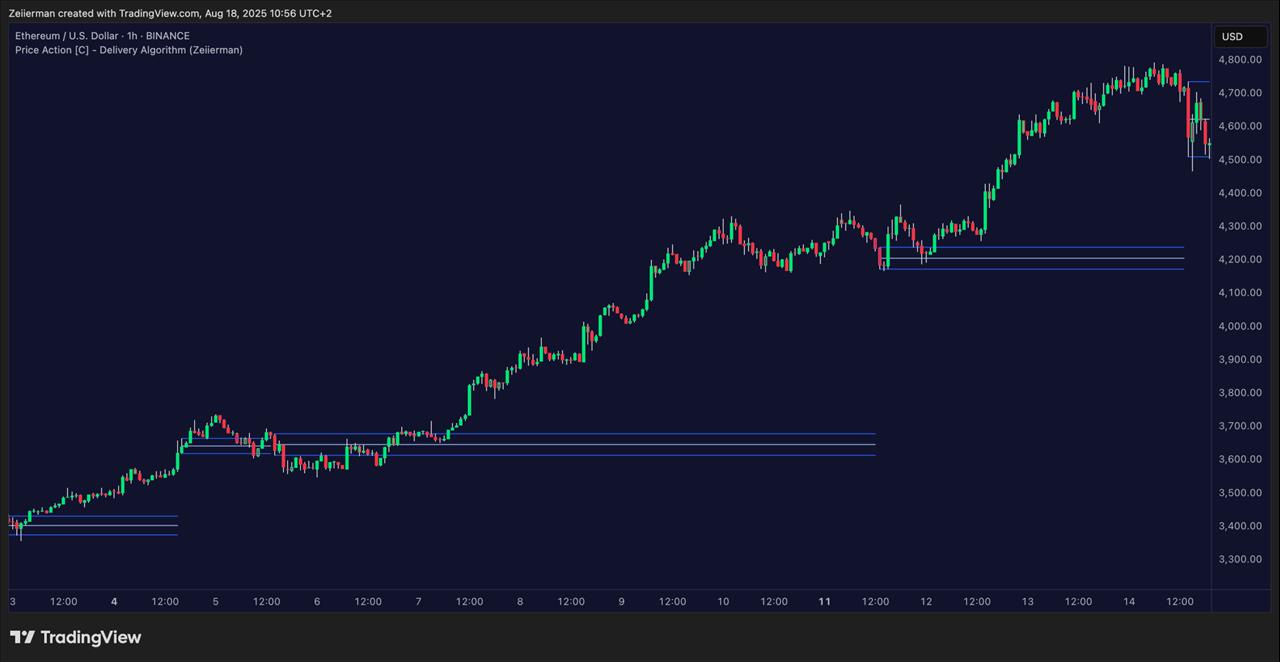
1. The Second-Opinion Workflow (Step-by-Step)We put the Ethereum chart (1H) through our AI Chart Analyzer to get the ins and outs of the current trend.
Step 1: 60-Second Market Read and AssessmentStart by scanning the Market Assessment at the top of the AI report. You'll see three scores: Trend Strength (for clarity of direction), Momentum (for clarity of market force), and Volatility (for clarity of stability).
If the trend strength and momentum are aligned, and the volatility looks manageable, I proceed to planning the trade almost instantly. If the trend strength is strong but with a weak momentum (or vice versa), we need more market context before making any decisions. There might be a pullback incoming. Finally, and most importantly, if the volatility is extreme, I usually sit out unless there's an extraordinary circumstance.
Bottom Line: Treat these like vitals. They don't tell you what to trade; they tell you how aggressively to trade.
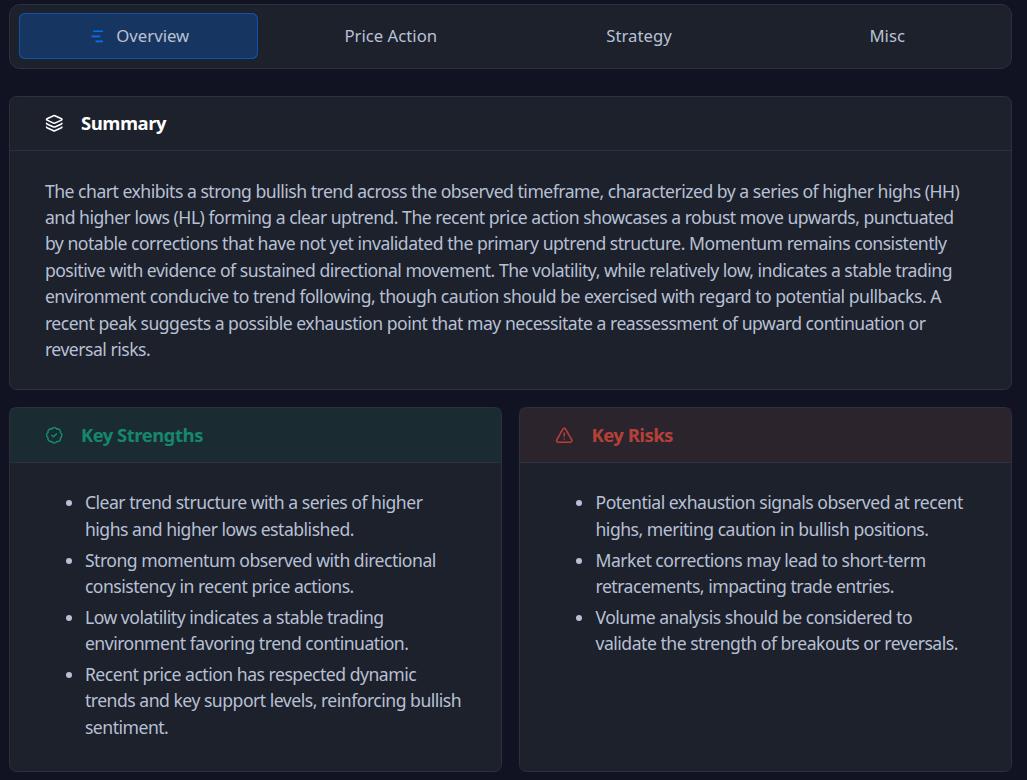
Step 2: Set Bias and Map Price LevelsOpen the Overview tab and read it like a morning brief. You'll receive a Summary of the trend/structure, along with key strengths and key risks. If strengths and risks cancel each other out (e.g., clear trend but immediate overhead resistance), I flag“ setup must be perfect ” or I wait for resolution.
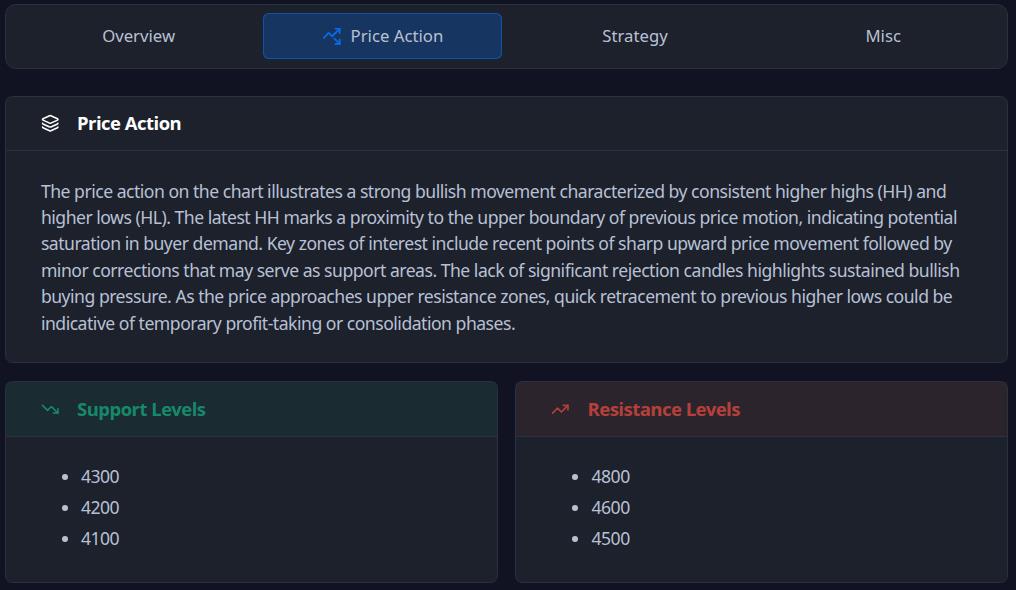
Remember that the overview is not your entry trigger. It's the context that prevents fighting the market. Next, switch to the Price Action tab for the price action summary and support/resistance levels. In my experience, this is where ideas become plans.
What I extract:
- Active zones only: I mark 2–3 supports and 2–3 resistances that are currently in play. Reaction expectations: For each level, I decide: reject, reclaim, and restest behaviours that I'm willing to trade.
If the price closes above resistance and retests as support with constructive candles, I'll look into a long trade. Otherwise, I'll look for a short if the price wicks above resistance but closes back below.
📌 Pro Tip: Place stops beyond the obvious level (where liquidity sits), not at the level.
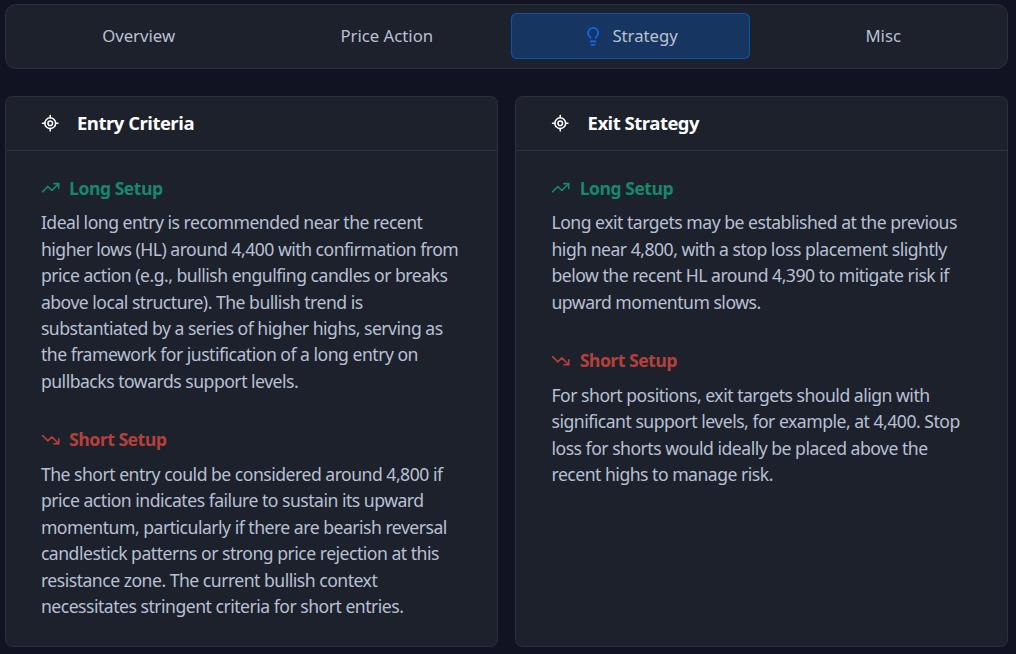
Step 3: Draft the Plan in StrategyFinally, open the strategy tab. You'll see Long Entry , Short Entry , and Exit Strategy guidance. Turn it into a strict if-then plan.
Here's my template:
- Long if: structure supports higher, price reclaims X (former resistance), and we get a constructive retest Short if: lower-high structure persists, price fails at Y and closes back inside the range
And then comes the part you were waiting for: how I plan my exits.
- Targets: Align with Price Action's next logical level (don't get greedy). Stops: Put them past invalidation, not past discomfort. Management: Pre-define partials (e.g., scale at first trouble area) and what invalidates the idea mid-trade.
Pro Tip: If I can't write a clean if-then in one sentence, the setup isn't defined enough to trade.
Step 4: Validate with Zeiierman Indicators (Confluence Check)Of course, you can use any indicator that's well-tested and backed by data. But I prefer mine, haha. Now I jump to TradingView for confirmation with our indicators. The goal is to ensure that the plan provided by AI is also supported by the live chart through relevant indicators.
What I look for:
- SMC read: Do I have CHoCH/BMS that matches the AI's directional bias? Are order blocks and premium/discount context aligned with the entry idea?
- Trend direction: I check the Range & Trend indicator to confirm trend direction. More often than not, it also assists with planning entries and exits.
- Liquidity/Levels: Are targets/stops near liquidity pools the market is likely to reach or defend?
- FVG & Volume cues: Does entry timing coincide with an imbalance refill or participation uptick (not a ghost move)?
When strategy conditions from the AI are visible on my indicators at the same levels , I proceed. If AI suggests a long position but SMC shows a fresh lower high and supply overhead, I pass or wait for a reclaim.
📌 Pro Tip: Confluence is not“more indicators.” The idea is to have multiple independent reads pointing to the same trade idea.
Step 5: Define Risk and Skip rules.Before entering any trade, my final step is to set up some ground rules.
For risk management, I define rules for invalidation (if price does X, tap out), a minimum risk-reward ratio, and finally, trade size. More often than not, my trade size is the inverse of market volatility.
Additionally, I skip the trade if the stock has an imminent major news, a weekend chop or an illiquid session that might distort volatility.
Step 6: Execute or PassIf the time is ripe, execute your plan by entering the trigger and placing stop-loss + take-profit levels.
Otherwise, if you're passing the trade, journal the“why” of your decision. In my experience, the ability to enter a profitable trade doesn't only come from technical analysis, but also through a feedback loop. Ten tight journals beat a hundred random trades.
2. Common Pitfalls (and Fixes)Let's talk about what could go wrong, so we can avoid it as much as possible.
Treating AI output as a signal: Use it as a second opinion only. No actual trigger equals no trade.
Ignoring higher-timeframe context: Align with the HTF bias first. If LTF and HTF disagree, I either scale down risk or skip until the HTF structure (BOS/CHoCH) supports the idea.
Mid-range entries (getting chopped): Trade edges or reclaim/rejects at well-defined support/resistance. If the price is mid-range, I wait for a sweep or a level reclaim.
Stops at obvious levels: Place stops beyond liquidity, not on it. Expect wicks. Let the market do its stop-hunt without you.
Over-confluence (indicator stacking): Keep a two-independent-signals rule: AI plan + one (or two) strong confirmations (e.g., SMC BOS/CHoCH or Liquidity confluence).
Volatility mismatch: Scale position size by Volatility score. High volatility corresponds to a smaller size and wider stops, while low volatility corresponds to standard size.
3. Quick ChecklistsPre-Trade Checklist
- Bias set?
Read the Overview tab and write down your understanding of the current trend. Market Assessment shows trend/momentum not fighting each other; volatility is manageable for your style.
- Levels mapped?
From Price Action, mark 2–3 supports and 2–3 resistances that matter now. Make sure you know exactly how the price should behave at each (reject, reclaim, retest).
- If-then plan defined?
From the Strategy tab, you have Long if... / Short if... conditions in one clear sentence each. Exits are also pre-planned (targets at logical levels; stops past invalidation, not past discomfort).
- Confluence confirmed?
The SMC indicator agrees on structure (BOS/CHoCH, OB context, premium/discount). Liquidity/Levels + FVG/Volume supportentry timing and target path.
- Risk & skip rules checked?
Minimum R:R is sane; size adjusted to current volatility. No news/illiquid session landmines; Risk Assessment doesn't flag show-stoppers.
📌 Pro Tip: If any item above is a“maybe,” it's a no . Process over impulse.
Post-Trade (1-Minute) Review- Did the price behave as planned? If not, where was the first deviation? Was invalidation correct? Did the stop sit beyond liquidity , not on it? Was confluence real or narrative? Did SMC/liquidity/FVG truly align, or did I force the read?
If you're ready to replace guesswork with a repeatable process, try the AI Analyzer and run your next setup through this second-opinion flow. Keep your edge, add structure, and let the data do the heavy lifting-then you pull the trigger.
And if you have any more questions, you can always hop on our Discord Community or ask us directly on zeiierman .
Crypto Investing Risk WarningCrypto assets are highly volatile. Your capital is at risk. Don't invest unless you're prepared to lose all the money you invest.
Legal Disclaimer:
MENAFN provides the
information “as is” without warranty of any kind. We do not accept
any responsibility or liability for the accuracy, content, images,
videos, licenses, completeness, legality, or reliability of the information
contained in this article. If you have any complaints or copyright
issues related to this article, kindly contact the provider above.




Comments
No comment