403
Sorry!!
Error! We're sorry, but the page you were looking for doesn't exist.
EUR/USD Signal 19/08: Chart Pattern More Gains (Chart)
(MENAFN- Daily Forex) Bullish pattern
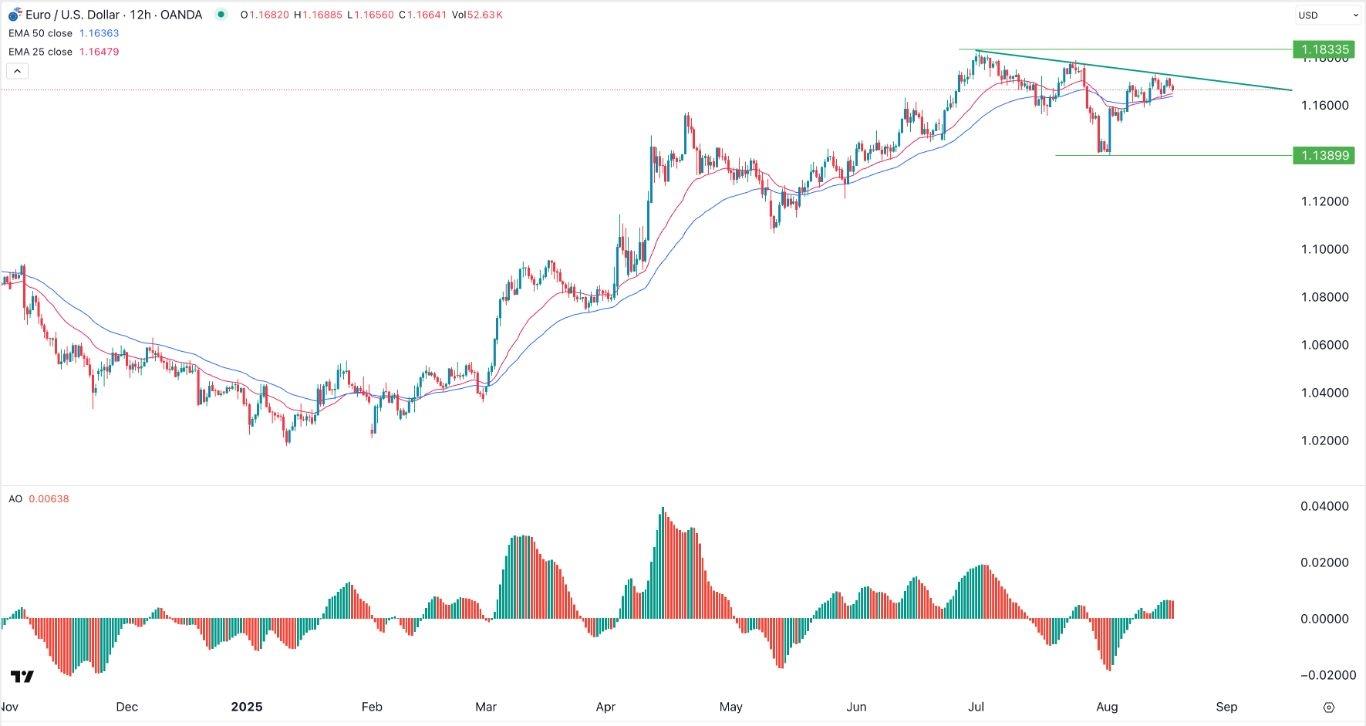
- Buy the EUR/USD pair and set a take-profit at 1.1835. Add a stop-loss at 1.1550. Timeline: 1-2 days.
- Sell the EUR/USD pair and set a take-profit at 1.1550. Add a stop-loss at 1.1835.
Michele Bowman, a senior Federal Reserve official, will also talk, and likely maintain her view that the bank should start cutting interest rates as soon as possible.
EURUSD Chart by TradingViewEUR/USD Technical AnalysisThe 12-hour chart shows that the EUR/USD pair has moved sideways in the past few days as market participants reflect on the next actions by the Federal Reserve. It was trading at 1.1667, lower than last week's high of 1.1727.The pair has formed an inverse head-and-shoulders pattern, a popular bullish reversal pattern. Also, the Awesome Oscillator indicator has remained above the zero line, a sign that bulls are in control.Therefore, the pair will likely have a strong bullish breakout, with the next target being the year-to-date high of 1.1835. A break above that level will point to more gains, potentially to 1.200 later this year.Ready to trade our daily Forex signal ? Check out the best forex brokers in Europe worth using.
Legal Disclaimer:
MENAFN provides the
information “as is” without warranty of any kind. We do not accept
any responsibility or liability for the accuracy, content, images,
videos, licenses, completeness, legality, or reliability of the information
contained in this article. If you have any complaints or copyright
issues related to this article, kindly contact the provider above.


Comments
No comment