GBP/USD Forex Signal Today 16/06: Rising Wedge Ahead (Chart)
(MENAFN- Daily Forex) Bearish view
- Sell the GBP/USD pair and set a take-profit at 1.3435. Add a stop-loss at 1.3700. Timeline: 1-2 days.
- Buy the GBP/USD pair and set a take-profit at 1.3700. Add a stop-loss at 1.3435.
The BoE will then deliver its interest rate decision on Thursday, with most analysts expecting it to leave them unchanged. The general view is that the bank will cut in its August meeting.
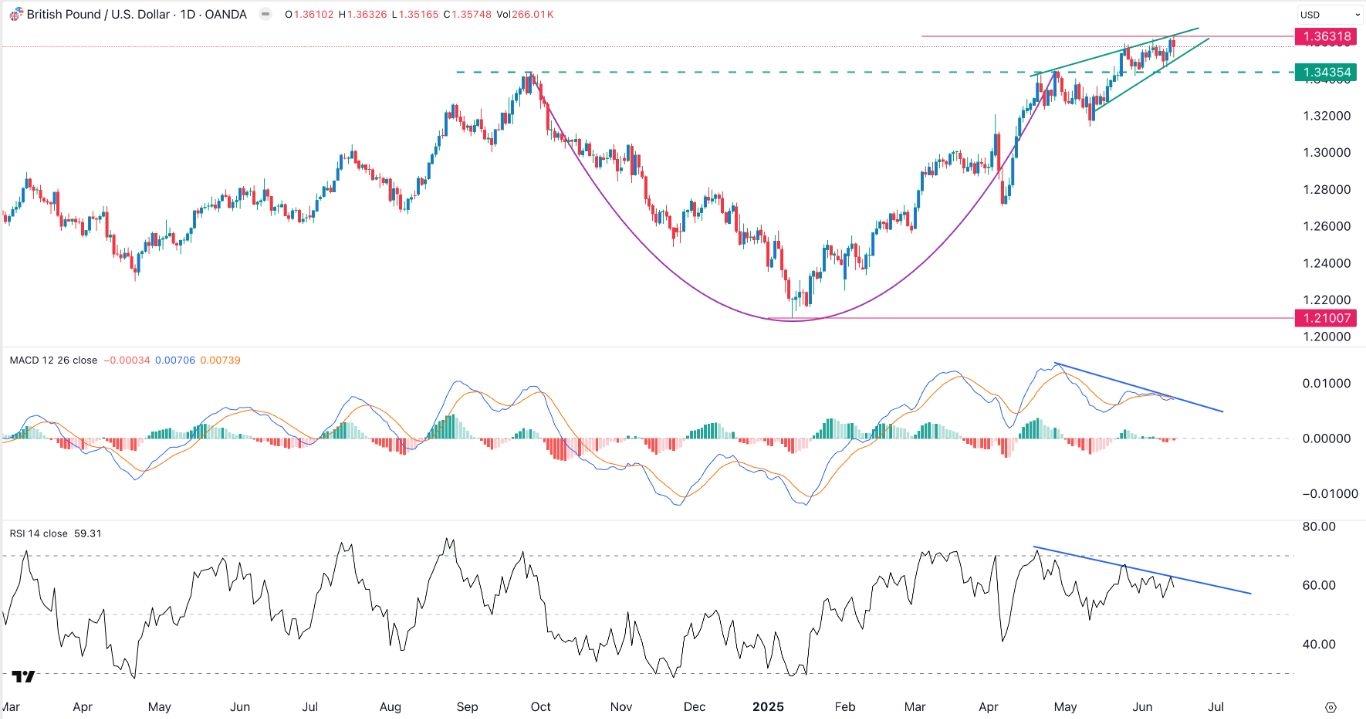
EURUSD Chart by TradingViewGBP/USD technical analysisThe daily chart shows that the GBP/USD exchange rate has been in a bullish trend in the past few weeks. It moved to a high of 1.3631 last week, much higher than the year-to-date low of 1.2100.On the positive side, the pair has formed a cup-and-handle pattern, a popular continuation sign. It has also remained above the 50-day and 25-day Exponential Moving Averages (EMA).The pair has also formed a rising wedge pattern, comprising of two ascending and converging trendlines. This wedge is nearing the confluence level, pointing to a bearish breakdown. The Relative Strength Index (RSI) and the MACD indicators have formed a bearish divergence point.Therefore, the pair will likely have a bearish breakdown, potentially to the upper side of the cup at 1.3435.Ready to trade our free daily Forex trading signals ? We've shortlisted the best UK forex brokers in the industry for you.
Legal Disclaimer:
MENAFN provides the
information “as is” without warranty of any kind. We do not accept
any responsibility or liability for the accuracy, content, images,
videos, licenses, completeness, legality, or reliability of the information
contained in this article. If you have any complaints or copyright
issues related to this article, kindly contact the provider above.
Most popular stories
Market Research

- Ethereum-Based Meme Project Pepeto ($PEPETO) Surges Past $6.5M In Presale
- 1Inch Unlocks Access To Tokenized Rwas Via Swap API
- Meme Coin Little Pepe Raises Above $24M In Presale With Over 39,000 Holders
- Chipper Cash Powers 50% Of Bitcoin Transactions With Bitcoin Lightning Network Via Voltage
- Kucoin Partners With Golf Icon Adam Scott As Global Brand Ambassador
- ROVR Releases Open Dataset To Power The Future Of Spatial AI, Robotics, And Autonomous Systems


Comments
No comment