Supply and Demand Trading: A Forex Trader's Guide
(MENAFN- DailyFX) Supply and demand are the very determinants of price - any price. This applies to everything from your local farmers market, to a rare, one of a kind jewel, to theforeign exchange market . Traders that understand the dynamics of demand and supply are better equipped to understand current and future price movements in the forex market.
This article covers the following talking points:
- Supply and demand trading explained
- Understanding Supply and Demand Zones
- 3 Tips for using supply and demand to trade forex
- Supply and demand trading strategies
Supply and demand trading explained
Often, acurrency pairwill climb to an area of resistance called a 'selling zone', where sellers perceive there to be great selling potential at a relatively overbought price. The reverse is also true for currency pairs that drop to relatively low levels, 'demand zone' where buyers perceive there to be great value to buy.
If you haven't learned the basics of the supply and demand, or would like a refresher, read our guide on theforces of supply and demand .
Understanding Supply and Demand Zones
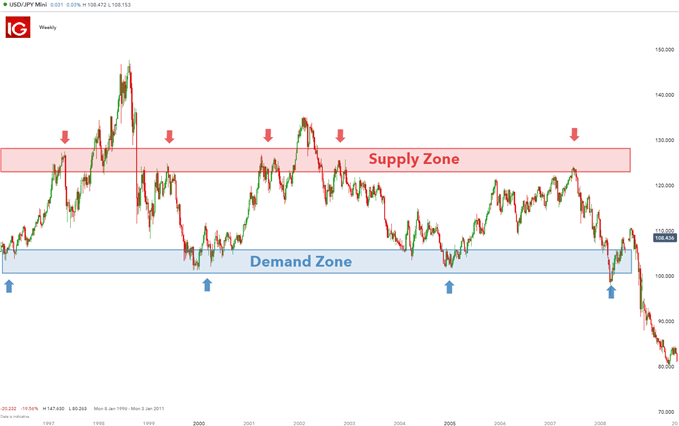
Supply and demand zones are observable areas on aforex chartwhere price has approached many times in the past. Unlike lines ofsupport and resistance , these resemble zones more closely than precise lines.
Traders can customize charts to identify the demand and supply zones as shown on theUSD/JPYbelow.

3 Tips for Using Supply and Demand to Trade Forex
1) Use longer time frames to identify supply and demand zones
By zooming out, traders are able to get a better view of areas where price had bounced off previously. Be sure to use the appropriate charts when altering the betweenmultiple time frames . Draw a rectangular shape to denote this zone. Demand and supply zones do not necessarily have to appear together - often currency pairs can reveal one or the other.
2) Identify strong moves off the potential demand/supply zone
Certain price levels offer value to eitherbullish or bearish traders . Once institutional traders and big banks see this value, they will look to capitalize on it. As a result, price action tends to accelerate relatively quickly until the value has diminished or has been fully realized. Witnessing multiple instances of this at the same price level increases the probability that it is an area of value and therefore, a supply or demand zone.
 -p
-p
Traders can incorporate daily or weeklypivot pointsto identify or confirm supply or demand zones. At DailyFX, we have a dedicated page showing relevantsupport and resistancelevels for all major markets. Traders should look for support and resistance levels to line up with demand and supply zones for higher probability trades.
 -p
-p

Supply and Demand Trading Strategies
Range trading strategy
Supply and demand zones can be used forrange tradingif the zones are well established. Traders can incorporate the use of astochastic indicatororRSIto assist in identifying overbought and oversold conditions.
Since this is a non-directional trade in terms of the trend, both long and short entries can be spotted. After viewing oversold/overbought conditions on a longer-term chart, traders can zoom into a smaller time frame to spot an ideal entry.
 -p
-p
The breakout strategy is another supply and demand trading strategy. Price cannot remain within a defined range forever and will eventually make a directional movement. Traders look to gain favorable entry into the market, in the direction of the breakout, as it may be the start of a strong trend.
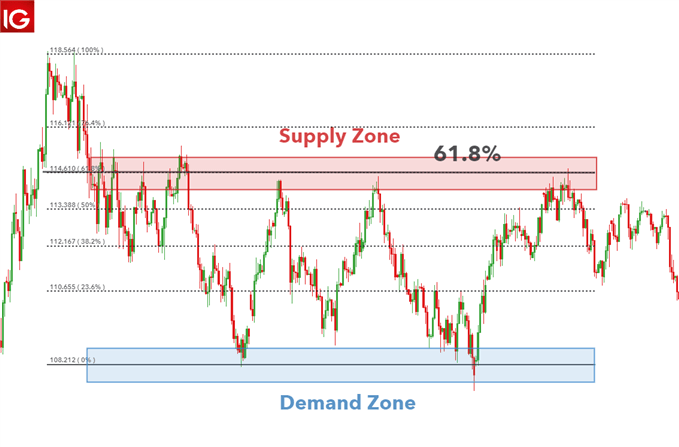
TheUSD/JPYchart shows a break out of the trading range but then retraces back towards the demand zone. Traders that place a short trade at the breakout are susceptible to being stopped out in this scenario. One way to mitigate this is to anticipate the retracement back to the demand zone before pacing the short trade.
 -p
-p
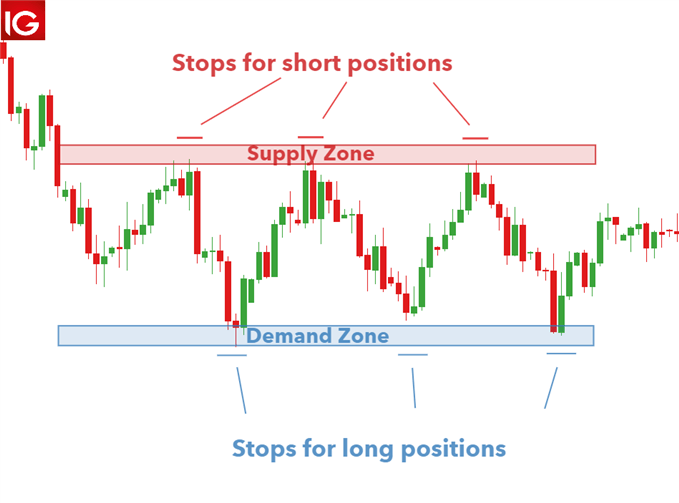
Demand and supply zones are very similar tosupport and resistanceand therefore, these areas provide an indication as to where a trader can place stops and limits.
These areas allow traders to implement a positiverisk to rewardapproach on all trades. Range traders that are selling at the supply zone can setstopsabove the supply zone and targets at the demand zone. Conservative traders can set the target above the demand zone or implement a number of otherrisk management techniques .
TheUSD/SGDchart below shows how stops and limits can be placed with reference to supply and demand zones:
 -p
-p
Further reading on Supply and Demand and FX trading
- Supply and demand zones are created by the interaction of the individual concepts of 'supply' and 'demand'. Learn about theforces of supply and demandto better locate supply and demand zones.
- At DailyFX we have provide up to datesupport and resistancelevels for all major markets.
- If you are just starting out on your trading journey download our freenew to forextrading guide to get to grips with the basics.

Legal Disclaimer:
MENAFN provides the
information “as is” without warranty of any kind. We do not accept
any responsibility or liability for the accuracy, content, images,
videos, licenses, completeness, legality, or reliability of the information
contained in this article. If you have any complaints or copyright
issues related to this article, kindly contact the provider above.


Comments
No comment