


403
Sorry!!
Error! We're sorry, but the page you were looking for doesn't exist.

How to Apply the Bollinger Bandwidth Strategy
(MENAFN- DailyFX) The Bollinger Bandwidth indicator can provide invaluable signals for technical traders, and when combined with othertechnical indicatorsandprice actiontechniques, gives traders insight into bothvolatilityand potential reversals in theforex market .
Before reading further, be sure to understand the basics of theBollinger Band®
This article explores:
What is the Bollinger Bandwidth Strategy? How does the Bollinger Bandwidth indicator work? How to calculate Bollinger Bandwidth Applying the Bollinger Bandwidth Strategy: Top Tips Advantages and Limitations of the Bollinger Bandwidth strategy
What is the Bollinger Bandwidth Strategy?
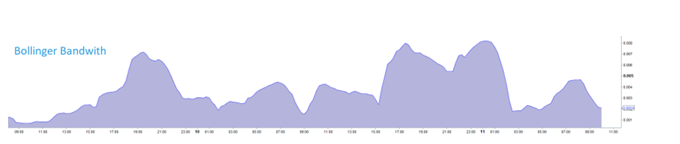
The Bollinger Bandwidth strategy uses the Bollinger bandwidth indicator to measure the difference in percentage between the upper and lower bands of the traditional Bollinger Band® indicator. On most charting platforms, the Bollinger Bandwidth indicator is represented beneath the primary chart as an oscillator type layout (see image below).
How does the Bollinger Bandwidth indicator work?
The Bollinger Bandwidth indicator illustrates periods of varying volatility relative to the market price movement. The chart below shows how volatility falls when the Bollinger Band® width contracts and rises when the width expands. After periods of consolidation (low volatility), it is often noted that price tends move in an asserted fashion either up or down. Contrary to this, when the Bollinger Bandwidth indicator increases to relative highs (high volatility), this regularly signals a reversal in current trend.
 -p
-p
The Bandwidth formula is:
Bandwidth = (Upper Bollinger Band® - Lower Bollinger Band®)/Middle Bollinger Band®
Applying the Bollinger Bandwidth Strategy: Top Tips
Traders can trade with the Bollinger Bandwidth indicator in several different ways but two of the most common ways to trade with this indicator involve breakout and reversal movements.
Bollinger Bandwidth low volatility strategy
 -p
-p
Unfortunately, the Bollinger Bandwidth indicator does not offer any further trade support which is why traders rely on other trading techniques to confirm entry and exit levels. This can be taken fromprice action , Bollinger Band® and other technical methods.
Bollinger Bandwidth reversal strategy
 -p
-p
This example also provides further supporting evidence with thelong wick candleformation, indicating a rejection of the new low by bulls. As mentioned previously, the Bollinger Bandwidth indicator does not specify entry/exit levels so other tools need to be used in conjunction.Fibonacci level s are often used to determine theses entry/exit levels as well as price action trend lines to establishsupport and resistancepoints.
Advantages and Limitations of the Bollinger Bandwidth strategy
| Advantages | Limitations |
Easy to access and understand | Requires use of supporting technical tools and indicators |
Identifies strong potential movements in price (high risk-reward ratios) | Utilised in different circumstances which can be tricky for novice traders to distinguish between the respective methods |
Further reading on Bollinger Bands®Bollinger Bands® provide traders with a visual representation of volatility in the market. Learn more with our guide totrading forex with Bollinger Bands® ReadDay trading Bollinger Bands®to get to grips with a Bollinger scalping strategy. Another approach to incorporate into your trading strategy is theBollinger Bands® and MACD combination.

Legal Disclaimer:
MENAFN provides the
information “as is” without warranty of any kind. We do not accept
any responsibility or liability for the accuracy, content, images,
videos, licenses, completeness, legality, or reliability of the information
contained in this article. If you have any complaints or copyright
issues related to this article, kindly contact the provider above.
Most popular stories
Market Research

More Story


Comments
No comment