


403
Sorry!!
Error! We're sorry, but the page you were looking for doesn't exist.

MACD: The Moving Average Convergence Divergence Explained
(MENAFN- DailyFX) MACD Indicator – Talking Points:What is MACD? What does MACD measure? How is MACD calculated? Limitations of MACD What is MACD?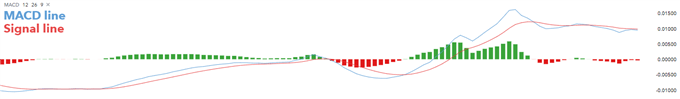
 How is MACD calculated?
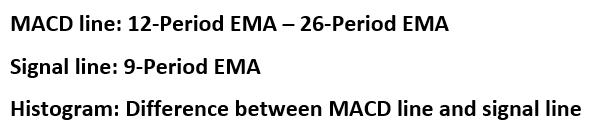
The Moving Average Convergence Divergence (MACD) is a technical indicator which simply measures the relationship ofexponential moving averages (EMA) .The MACD displays a MACD line (blue), signal line (red) and a histogram (green) - showing the difference between the MACD line and the signal line.
The MACD line is the difference between two exponentially levelled moving averages – usually 12 and 26-periods, whilst the signal line is generally a 9-period exponentially smoothed average of the MACD line.
These MACD lines waver in and around the zero line. This gives the MACD the characteristics of an oscillator giving overbought and oversold signals above and below the zero-line respectively.
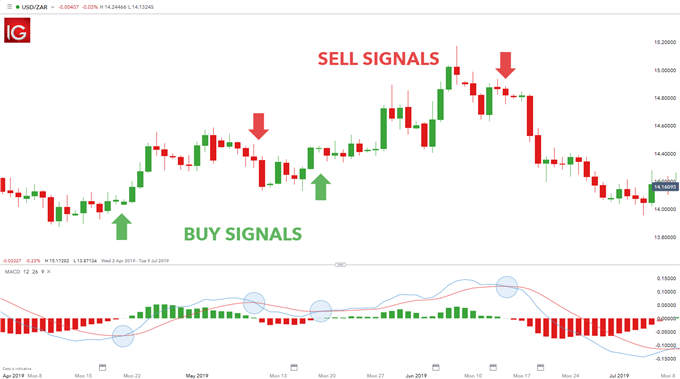
What does MACD measure?The MACD measures momentum or trend strength by using the MACD line and zero line as reference points:
When the MACD line crosses ABOVE the zero line, this signals an UPTREND When the MACD line crosses BELOW the zero line, this signals an DOWNTRENDIn addition, the MACD signals buy or sell orders which are given when the two MACD lines cross over as outlined below:
When the MACD line crosses ABOVE the signal line, traders use this as a BUY indication When the MACD line crosses BELOW the signal line, traders use this as a SELL indication How is MACD calculated?Most charting platforms offer the MACD indicator, and implement this calculation using the aforementioned default periods. The formula below breaks down the varying components of the MACD to make it comfortable for traders to apply.
As mentioned previously, the MACD histogram plots the difference between the two moving average lines. The histogram fluctuates in and around the zero designation on the MACD indicator. When the MACD line is above the signal line, then the histogram will be positive. The opposite is true when the MACD line sits below the signal, whereby the histogram will plot below the zero as a negative value. A zero value on the histogram indicates a crossing over of the two moving average lines thus marking buy/sell signals.
Limitations of MACDThe MACD indicator is considered to work best intrendingmarkets. This limits its use for traders depending on theirtrading strategies . For example, range bound/consolidating markets will generally give flawed signals when using the MACD. Traders will need to truly understand the MACD as well as when to employ the indicator for optimal use. Novice traders may find this indicator difficult to use initially, which is why going through basic moving average and EMA fundamentals will benefit traders who are looking to make use of the MACD indicator.
The variations that can be implemented with the MACD indicator is almost infinite which makes it very personal to the trader. This subjective nature of the MACD will mean that results differ from trader to trader which take away any consistency. Traders will need to follow a basic outline when using the MACD:
Selecting EMA parameters Using an appropriate time frame, as MACD may function differently across time frames MACD Indicator: A SummaryThe MACD is unique in that it serves as an oscillator as well as MACD crossover indicator. This dual purpose gives two signals in one indicator allowing for a less cluttered chart. Traders may find this useful which makes understanding the MACD worthwhile.
Become a Better Trader with Our Trading TipsLearn about other oscillators and indicators to enhance your trading for both beginner and experienced traders: Relative Strength Index (RSI)Exponential Moving Average (EMA)Simple Moving Average (SMA) Technical traders have different styles and forex trading strategies . Explore these thoroughly to find out if this type of analysis suits your personality If you are just starting out on your trading journey it is essential to understand the basics of forex trading in ournew to forexguide
Legal Disclaimer:
MENAFN provides the
information “as is” without warranty of any kind. We do not accept
any responsibility or liability for the accuracy, content, images,
videos, licenses, completeness, legality, or reliability of the information
contained in this article. If you have any complaints or copyright
issues related to this article, kindly contact the provider above.
Most popular stories
Market Research

More Story


Comments
No comment