


USD/SGD May Reverse as Singapore Economy Contracts Most Since 2012
(MENAFN- DailyFX)
Singapore Dollar, GDP Talking PointsSGD falls as Singapore's economy sharply contracts in Q2 Softer CPI, trade war risk places focus on MAS SGD policyUSD/SGDdowntrend struggling around falling resistance
Trade all the major global economic data live as it populates in the economic calendar and follow the live coverage for key events listed in theDailyFX Webinars . We'd love to have you along.
The SGD weakened after the latest GDP report showed that Singapore's economy unexpectedly contracted by the most since 2012. The first estimate of second quarter GDP pointed to a 3.4 percent decline versus +0.5% anticipated and from +3.8% in the first quarter. Meanwhile, year-on-year GDP clocked in at just +0.1 percent which was the slowest pace of expansion since 2009.
Singapore Dollar Falls as GDP Contracts
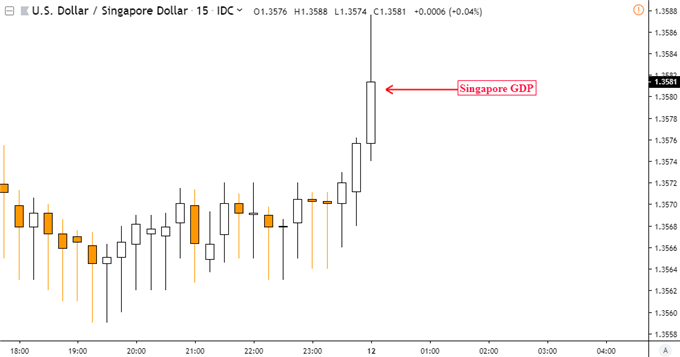
Chart Created in TradingView
The details of the report revealed that industrial components of growth contracted. Manufacturing and construction declined 6.0 and 7.6 percent respectively (QoQ). Combining these two segments of the economy adds up to roughly 25% of overall GDP according to the Department of Statistics Singapore. Furthermore, there was also a 1.5% contraction in services.
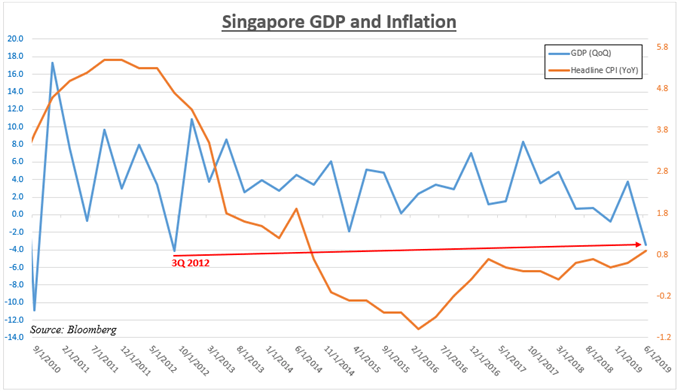
According to estimates by Bloomberg, economists are anticipating growth of about 2.1% y/y in 2019. Today's dismal readings undermine the outlook and puts the Monetary Authority of Singapore (MAS) in a tight spot. Looking at the chart below, headline CPI in the city-state has been steadily creeping higher. While the MAS revised CPI (all items) estimates lower, softer economic activity could also dampen headline inflation.
This places the focus on whether or not the monetary authority could continue its 'gradual appreciation' of the Singapore Dollar Nominal Effective Exchange Rate (S$NEER). A stronger currency works to dampen rising price pressures. Meanwhile, the impact of the US-China trade war is quite noticeable given the sectors most hurt in today's lackluster growth figures. It is unclear if thetrade trucereached by the two nations may last.
USD/SGD Technical Analysis
Below, USD/SGD finds itself oscillating between support at 1.3516 and resistance at the outer bound of 1.3624. This is while the dominant downtrend since late May struggles to remain intact. The falling trend line from then is currently being tested and clearing resistance opens the door to reversing USD/SGD's decline.
Something to keep in mind of is SGD'sclose relationshipto theUS Dollar , and if the MAS steps in to stem significant weakness in the Singapore Dollar given theirpolicy stance . For more updates on the Singapore Dollar, you can follow me on Twitter here at@ddubrovskyFX .
USD/SGD Daily Chart
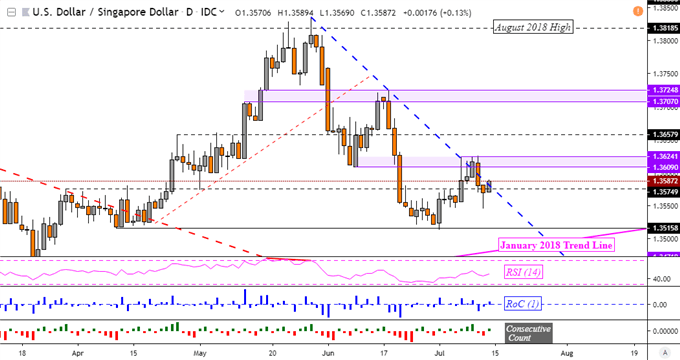
Chart Created in TradingView
Singapore Dollar Trading Resources
Just getting started?See our beginners' guide for FX traders Having trouble with your strategy?Here's the #1 mistake that traders make See how the US Dollar is viewed by the trading community at theDailyFX Sentiment Page
--- Written by Daniel Dubrovsky, Currency Analyst for DailyFX.com
To contact Daniel, use the comments section below or@ddubrovskyFXon Twitter
DailyFX

Legal Disclaimer:
MENAFN provides the
information “as is” without warranty of any kind. We do not accept
any responsibility or liability for the accuracy, content, images,
videos, licenses, completeness, legality, or reliability of the information
contained in this article. If you have any complaints or copyright
issues related to this article, kindly contact the provider above.
Most popular stories
Market Research

- Permissionless Data Hub Baselight Taps Walrus To Activate Data Value Onchain
- TOKEN2049 Singapore Breaks Records: 25,000 Attendees At The World's Largest Web3 Event
- Invromining Expands Multi-Asset Mining Platform, Launches New AI-Driven Infrastructure
- Meme Coin Little Pepe Raises Above $24M In Presale With Over 39,000 Holders
- VANTIR Launches To Transform Prop Trading With Transparency And Trust
- Daytrading Publishes New Study On The Dangers Of AI Tools Used By Traders
More Story


Comments
No comment