


403
Sorry!!
Error! We're sorry, but the page you were looking for doesn't exist.
Heliostar Announces Positive Prefeasibility Study For Cerro Del Gallo With Significant Expansion Potential
| Forecast Production Highlights | | |
| Ore Feed | 6,000 | Ktpa |
| Strip Ratio | 0.32:1 | W:O |
| Grade - LOM | 0.73 | g/t AuEq |
| Grade - Years 1-5 | 0.80 | g/t AuEq |
| Life of Mine Produced | 1,310 | Koz GEO |
| Processing Rate | 16,438 | Tpd |
| Process Recovery (Gold / Silver / Copper) | 59.4 / 49.3 / 61.8 | % |
| Life of Mine | 15.3 | Years |
| Annual Production - LOM | 85.7 | Koz GEO |
| Annual Production - Years 1-5 | 94.2 | Koz GEO |
| Forecast Financial Highlights | ||
| Average Cash Costs (US$ per GEO) 1 | $1,252 | /oz |
| Average AISC (US$ per GEO) 1 | $1,390 | /oz |
| Total Initial Capital Cost | $195.3 | M |
| Total Sustainable Capital Cost | $160.3 | M |
| Total Life of Mine Capital Cost 2 | $355.6 | M |
| Forecast Return Estimates based on Gold Price 1, 2 | ||
| US$2,300/oz 3 | US$3,900/oz 4 | |
| IRR | 33.1% | 59.3% |
| NPV @ 5% discount | $423.9M | $972.4M |
| Payback | 2.3 years | 1.4 years |
All other key parameters set at base assumptions, including the 5% discount rate used. More detailed analysis will be presented in the full technical report. After tax return estimates. Base gold price assumption used in the technical report. Comparison gold price of US$3,900 with reference to US$4,198 London Bullion Market Association (LBMA) PM gold price on trading day December 9, 2025.
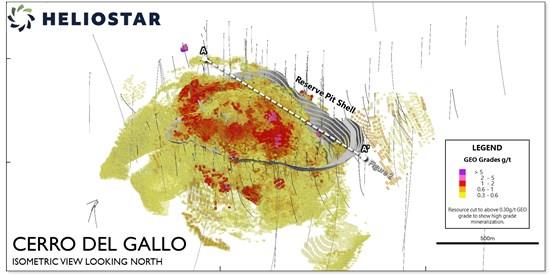
Figure 1 - Isometric View of Cerro del Gallo Resource with Reserve Pit Shell
To view an enhanced version of this graphic, please visit:

Figure 2 - Cross Section through Cerro del Gallo Resource with Reserve Pit Shell
To view an enhanced version of this graphic, please visit:
Forecast Operating Cost Estimates
Operating costs at the Cerro del Gallo Project will benefit from the simplicity of a truck and shovel open pit mine, very low strip ratio, and access to low-cost grid power and regional infrastructure. The crush-agglomerate-heap-leach-ADR-SART flowsheet utilizes industry standard equipment and processes. It supports efficient processing of the Cerro del Gallo ore with moderate reagent use and no requirement for milling or conventional tailings storage.
Estimations of total cash costs average US$1,252/GEO, with AISC of US$1,390/GEO over the 15.3-year mine life. Revenue credits from copper and silver recovered through the SART circuit further strengthen operating margins and contribute to a robust, long-life cost profile.
Total Operating Cost Summary
| Operating Costs | Operating Cost (US$/GEO) | Operating Cost (US$/t ore) |
| Total mining | $274.02 | $3.79 |
| Total processing | $658.44 | $9.12 |
| Total site general and administrative | $65.61 | $0.91 |
| Smelter, Refinery and Transport | $68.55 | $0.95 |
| Cash operating costs | $1,066.62 | $14.77 |
| Production taxes | $80.29 | $1.11 |
| Royalties | $105.12 | $1.46 |
| Total cash costs | $1,252.03 | $17.33 |
| Sustaining capital costs | $138.2 | $1.91 |
| Total AISC | $1,390.23 | $19.25 |
Forecast Capital Cost Estimates
The initial capital cost for the project is estimated to be $195.3M including $15.6M for initial working capital (60 days) and $22.3M in total contingency. The total initial required capital expenditure will benefit from proximity to infrastructure and the assumption of a contractor-supplied fleet. Sustaining capital costs are primarily related to completion of a powerline to the site and three leach pad expansions. The cost estimate is based on more advanced work that will progress into a feasibility study, however, it includes a contingency of 17.5% of the total cost.
The Company's LOM plan allocates US$132.0M for reclamation work at the end of the mine life.
Forecast Capital Cost Summary
| Capital Costs | Initial (US$M) | Sustaining (US$M) | Total LOM (US$M) |
| Mining Costs | $1.4 | - | $1.4 |
| Mobile Equipment | $3.9 | - | $3.9 |
| Site & Utilities General | $10.2 | - | $10.2 |
| Power Generation & Site Distribution | $11.0 | - | $11.0 |
| Crushing Circuit | $28.8 | - | $28.8 |
| Agglomeration | $4.9 | - | $4.9 |
| Stacking System | $6.8 | - | $6.8 |
| Heap Leach Solution | $21.1 | - | $21.1 |
| SART Plant | $20.3 | - | $20.3 |
| Recovery Plant | $13.3 | $35.1 | $48.4 |
| Reagents | $2.5 | - | $2.5 |
| Laboratory | $2.9 | - | $2.9 |
| Total direct costs | $127.2 | $35.1 | $162.3 |
| Spare Parts | $5.7 | - | $5.7 |
| Initial Fills | $0.9 | | $0.9 |
| Contingency | $22.1 | $8.8 | $30.9 |
| Indirect Costs | $6.5 | - | $6.5 |
| Other Owner's Costs | $3.6 | - | $3.6 |
| EPCM | $13.8 | - | $13.8 |
| Working Capital (60 days) | $15.6 | -$15.6 | - |
| Closure and reclamation | - | $132.0 | $132.0 |
| Total indirect costs | $68.2 | $125.2 | $193.4 |
| Total Costs (excluding IVA) | $195.3 | $160.3 | $355.6 |
Economic Analysis
The economic analysis shows a base case after-tax net present value at a discount rate of 5% of US$423.9M, an after-tax internal rate of return of 33.1%, and a payback period of 2.3 years at US$2,300/oz gold. The projected mine life is 15.3 years in the PFS. Approximately 1,310k GEOs (888 koz gold, 22.2 Moz silver and 59 kT copper) are projected to be produced and sold over the life of the mine.
Summary Economic Results
| Project Valuation Overview | Units | After Tax | Before Tax |
| Total cash flow | US$ M | $724.1 | $1,166.9 |
| Average annual cash flow | US$ M | $47.6 | $76.3 |
| Average annual cash flow - Years 1-5 | US$ M | $77.6 | $104.7 |
| NPV @ 5.0% (base case) | US$ M | $423.9 | $699.4 |
| Internal rate of return | % | 33.1% | 44.9% |
| Payback period | Years | 2.3 | 1.8 |
| Payback multiple | x | 4.4 | 6.5 |
Metal Prices
The gold market has experienced significant upward price movement in the past few years. The gold price at the effective date of the technical report is about 83% above the base case gold price used in the study.
The sensitivity analysis presents gold price scenarios up to US$4,100/gold ounce (near spot prices) to understand the potential impact of continued gold price movements. From the base case price of $2,300/oz, a change in the average gold price of 10% (US$230/gold ounce) would change the after-tax NPV5% by approximately US$76.2M.
The economics of the Prefeasibility Study are most sensitive to changes in gold price and grade and less sensitive to operating costs and initial capital costs.
Gold Price Sensitivity Analysis
| Gold Price (US$/oz Gold) | Net Cash Flow (US$M) | After-Tax NPV @ 5.0% Discount Rate (US$ M) | IRR (%) | Payback Period (years) | Payback Multiple |
| 900 | -$43.38 | -$60.62 | - | 9.5 | 0.8 |
| 1,100 | $66.08 | $9.89 | 6.1% | 5.6 | 1.3 |
| 1,300 | $176.64 | $79.94 | 12.4% | 3.9 | 1.8 |
| 1,500 | $286.0 | $148.8 | 17.3% | 3.1 | 2.3 |
| 1,700 | $395.4 | $217.6 | 21.6% | 3.5 | 2.8 |
| 1,900 | $505.3 | $286.8 | 25.7% | 2.9 | 3.4 |
| 2,100 | $614.7 | $355.4 | 29.5% | 2.6 | 3.9 |
| 2,300 | $724.1 | $423.9 | 33.1% | 2.3 | 4.4 |
| 2,500 | $833.5 | $492.5 | 36.7% | 2.0 | 4.9 |
| 2,700 | $942.8 | $561.0 | 40.1% | 1.9 | 5.4 |
| 2,900 | $1,052.2 | $629.6 | 43.5% | 1.8 | 5.9 |
| 3,100 | $1,161.6 | $698.2 | 46.8% | 1.7 | 6.4 |
| 3,300 | $1,270.9 | $766.7 | 50.0% | 1.6 | 6.9 |
| 3,500 | $1,380.3 | $835.3 | 53.2% | 1.5 | 7.4 |
| 3,700 | $1,489.66 | $903.85 | 56.3% | 1.4 | 7.9 |
| 3,900 | $1,599.03 | $972.41 | 59.3% | 1.4 | 8.5 |
| 4,100 | $1,708.40 | $1,040.97 | 62.3% | 1.3 | 9.0 |
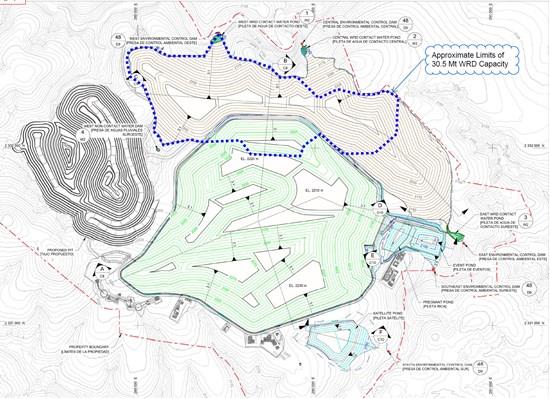
Figure 3 - Planned Cerro del Gallo Site Layout
To view an enhanced version of this graphic, please visit:
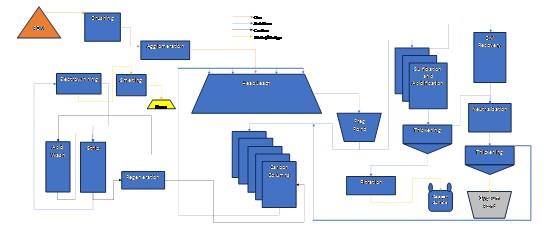
Figure 4 - Cerro del Gallo Process Flow Sheet
To view an enhanced version of this graphic, please visit:
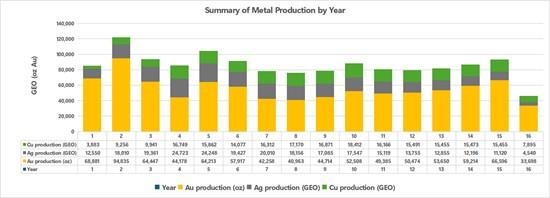
Figure 5 - Cerro del Gallo Planned Production Schedule
To view an enhanced version of this graphic, please visit:
Next steps
The next steps by Heliostar at Cerro del Gallo will focus on conversion of resources to reserves and additional resource growth.
This plan includes additional resource and reserve drilling, updating geological interpretations, metallurgical testing and trade off studies. Positive changes to the gold price have resulted in an increase to the potential size of the reserve. Additional metallurgical analysis and data points are required on the deposit to support this increase.
The Company intends to drill with a focus on increasing both mineral resources and reserves and to improve the geological interpretation for the deposit. Mineralization remains open to the north and at depth. The north is considered a high potential target for reserve growth but historically was not drilled due to surface access limitations. The drill density decreases at depth as noted in Figure 2 with in-fill drilling having potential to improve resource classifications. Further, mineralization is open at depth with potential to expand resources.
Subject to confirming the extent of the mineral resource at Cerro del Gallo, the Company intends to refine the planned process flowsheet, start preparing permitting and social plans and commence work to prepare a feasibility study. Development of Cerro del Gallo is planned after Ana Paula has been commissioned and is in production.
Mineral Resource Estimates
Mineral Resources for the Cerro del Gallo deposit were updated as part of the 2025 Prefeasibility Study and are summarized in the accompanying table. The Mineral Resources have an effective date of July 31, 2025, and are reported on an in-situ basis in accordance with the 2014 Canadian Institute of Mining, Metallurgy and Petroleum (CIM) Definition Standards for Mineral Resources and Mineral Reserves.
Mineral Resources Statement
| Classification | Material Type | NSR Cutoff | Tonnes (kt) | Grade | Contained Metal | ||||||
| Au g/t | Ag g/t | Cu % | AuEq g/t | Gold (koz) | Silver (koz) | Copper (t) | AuEq (koz) | ||||
| Indicated | Oxide | $11.81 | 10,733 | 0.41 | 17.92 | 0.09 | 0.60 | 141 | 6,184 | 9,659 | 207 |
| Mix Oxide | $10.66 | 13,613 | 0.28 | 11.12 | 0.08 | 0.50 | 123 | 4,867 | 10,890 | 219 | |
| Mix Sulfide | $11.81 | 70,066 | 0.40 | 13.70 | 0.09 | 0.68 | 901 | 30,862 | 63,060 | 1,532 | |
| Sulfide | $11.23 | 145,572 | 0.38 | 13.77 | 0.11 | 0.62 | 1778 | 64,447 | 160,129 | 2,902 | |
| Total | | 239,984 | 0.38 | 13.78 | 0.10 | 0.63 | 2,944 | 106,359 | 243,739 | 4,859 | |
| Inferred | Oxide | $11.81 | 2,042 | 0.19 | 21.08 | 0.09 | 0.40 | 12 | 1,384 | 1,838 | 26 |
| Mix Oxide | $10.66 | 1,604 | 0.14 | 16.12 | 0.07 | 0.40 | 7 | 831 | 1,123 | 21 | |
| Mix Sulfide | $11.81 | 10,501 | 0.28 | 13.75 | 0.11 | 0.57 | 95 | 4,642 | 11,552 | 192 | |
| Sulfide | $11.23 | 10,300 | 0.33 | 11.74 | 0.07 | 0.51 | 109 | 3,888 | 7,210 | 169 | |
| Total | | 24,448 | 0.28 | 13.67 | 0.09 | 0.52 | 224 | 10,746 | 21,722 | 408 |
Notes to accompany Mineral Resources table:
Mineral Resources are reported within a resource shell constrained by the property boundary using the 2014 CIM Definition Standards. Mineral Resources have an effective date of 31 July 2025. The Qualified Person for the estimate is Mr. Timothy O. Kuhl, Reg Mem SME and Principal Geologist with Mine Technical Services. An NSR is used for reporting Mineral Resources by material type. NSR cutoffs of $11.81 for Oxide, $10.66 for Mixed Oxide, $11.81 for Mixed Sulfide and $11.23 for Sulfide were used. The NSR is determined based on estimated processing costs of US$9.10/t, general and administrative costs of US$0.90t, production taxes and royalty costs of US$1.40/t. Metal prices of US$2,500/oz Au, US$30.50/oz Ag, and US$4.60/lb Cu were used in calculating the NSR. In addition, a gold recovery of 74%, a silver recovery of 60% and a copper recovery of 17% were used for Oxide material; a gold recovery of 68%, a silver recovery of 73% and a copper recovery of 62% were used for Mixed Oxide material; a gold recovery of 61%, a silver recovery of 58% and a copper recovery of 73% were used for Mixed Sulfide material; and a gold recovery of 53%, a silver recovery of 35% and a copper recovery of 59% were used for Sulfide material in the NSR calculation. Based on the stated metal prices and recoveries, the gold equivalent grades were calculated as AuEq = Au Grade + (((Cu Price in US$/lb * 22.0462 * Cu Recovery and Payable) / (Au Price in US$/g * Au Recovery and Payable)) * Cu Grade) + (((Ag Price in US$/g * Ag Recovery and Payable) / (Au Price in US$/g * Au Recovery and Payable)) * Ag Grade). The average overall payables from the smelter and refineries were estimated at 98.8% for gold, 90.1% for silver, and 88.2% for copper. Tonnage and grade estimates are in metric units. Mineral Resource tonnage and contained metal have been rounded to reflect the accuracy of the estimate, and numbers may not add due to rounding.Mineral Reserve Estimates
Mineral Reserves for the Cerro del Gallo deposit as part of the 2025 Prefeasibility Study have an effective date of July 31, 2025, are reported at the point of delivery to the leach facility, and are stated in accordance with the 2014 CIM Definition Standards for Mineral Resources and Mineral Reserves.
The Mineral Reserves estimate is based on a 6 Mtpa open-pit mining operation, with ore processed through the established crushing, agglomeration, heap-leach, ADR, and SART circuits. The resulting Mineral Reserves statement is provided in the following table.
Mineral Reserves Statement
| Classification | Material Type | Tonnes (kt) | Grade | Contained Metal | ||||||
| Au g/t | Ag g/t | Cu % | AuEq g/t | Gold (koz) | Silver (koz) | Copper (t) | AuEq (koz) | |||
| Probable | Oxide | 9,198 | 0.46 | 18.46 | 0.08 | 0.65 | 137 | 5,459 | 7,714 | 193 |
| Mix Oxide | 4,411 | 0.42 | 10.74 | 0.09 | 0.64 | 59 | 1,524 | 4,115 | 91 | |
| Mix Sulfide | 38,761 | 0.50 | 15.26 | 0.10 | 0.80 | 629 | 19,020 | 37,354 | 995 | |
| Sulfide | 39,524 | 0.53 | 15.00 | 0.12 | 0.78 | 670 | 19,064 | 45,557 | 997 | |
| Total | 91,893 | 0.51 | 15.25 | 0.10 | 0.77 | 1,495 | 45,066 | 94,740 | 2,275 |
Notes to accompany Mineral Reserves table:
Mineral Reserves are reported at the point of delivery to the process plant, using the 2014 CIM Definition Standards. Mineral Reserves have an effective date of 31 July 2025. The Qualified Person for the estimate is Mr. Jeffrey Choquette, P.E., of Hard Rock Consulting. An NSR cutoff of $12.50/t was used for reporting the Mineral Reserves which is based on estimated processing costs of US$9.10/t, general and administrative costs of US$0.90t, production taxes and royalty costs of US$1.40/t. Metal prices of US$2,200/oz Au, US$26.50/oz Ag, and US$4.00/lb Cu were used in calculating the NSR. In addition, a gold recovery of 74%, a silver recovery of 60% and a copper recovery of 17% were used for Oxide material, a gold recovery of 68%, a silver recovery of 73% and a copper recovery of 62% were used for Mixed Oxide material, a gold recovery of 61%, a silver recovery of 58% and a copper recovery of 73% were used for Mixed Sulfide material and a gold recovery of 53%, a silver recovery of 35% and a copper recovery of 59% were used for Sulfide material in the NSR calculation. Based on the stated metal prices and recoveries, the gold equivalent grades were calculated as AuEq = Au Grade + (((Cu Price in US$/lb * 22.0462 * Cu Recovery and Payable) / (Au Price in US$/g * Au Recovery and Payable)) * Cu Grade) + (((Ag Price in US$/g * Ag Recovery and Payable) / (Au Price in US$/g * Au Recovery and Payable)) * Ag Grade). The average overall payables from the smelter and refineries were estimated at 98.8% for gold, 90.1% for silver and 88.2% for copper. Mineral Reserves are reported within the ultimate reserve pit design. Tonnage and grade estimates are in metric units. Mineral Reserve tonnage and contained metal have been rounded to reflect the accuracy of the estimate, and numbers may not add due to roundingQualified Persons
The technical report for the Cerro del Gallo Project will be prepared for Heliostar Metals Ltd. by Mr. Ted Eggleston, Ph.D., RM SME, PGEO, Mr. Tim Kuhl, MSc, RPG, RM-SME, Mr. Jeffrey Choquette, P.E., Mr. Marvin Silva, PhD, PE, PEng., Mr. Todd Minard P.E., Mr. Travis Manning, P.E., QP, Mr. Carl Defilippi, RM SME, and Ms. Dawn Garcia, CPG. Each of these Qualified Persons has reviewed and approved the technical information contained in this news release in their area of expertise and are independent of the Company.
Qualified Persons with Respect to this News Release
Gregg Bush, P.Eng. and Mike Gingles, the Company's Qualified Persons, as such term is defined by National Instrument 43-101 - Standards of Disclosure for Mineral Projects, have reviewed the scientific and technical information not derived from the updated technical reports and included in this news release in the Company Overview, Commentary by the Company on Relevant Matters and Commentary by the Company on Next Steps and Permitting sections for each property and have approved the disclosure herein.
Data Verification
The Qualified Persons for the technical reports verified the data in the report for their areas of expertise and concluded that the information supported Mineral Resource estimation, and could be used in mine planning and economic analysis. The verification completed by each Qualified Person is discussed in each technical report and included site visits, and could include data audits, evaluation of the suitability of data for use in estimation and mine planning, quality assurance and quality control checks, review of available technical and economic study data, review of data collection and evaluation methods, review of production data including reconciliation where available, review of actual cost data for operations, and review of third-party inputs to forecasts.
The Company's Qualified persons verified the information that was not derived from the technical reports. The data verification included site visits, data audits, review of available study data, review of data collection and evaluation methods, review of production data including reconciliation where available, review of actual cost data for operations, and review of third-party inputs to forecasts, and consideration of the Company's plans for the projects.
About Heliostar Metals Ltd.
Heliostar is a gold mining company with production from operating mines in Mexico. This includes the La Colorada Mine in Sonora and the San Agustin Mine in Durango. The Company also has a strong portfolio of development and exploration stage projects in Mexico and the USA. These include the Ana Paula project in Guerrero, the Cerro del Gallo project in Guanajuato, the San Antonio project in Baja Sur, all in Mexico and the Unga project in Alaska, USA.
FOR ADDITIONAL INFORMATION PLEASE CONTACT:
| Charles Funk President and Chief Executive Officer Heliostar Metals Limited Email: ... Phone: +1 844-753-0045 | Rob Grey Investor Relations Manager Heliostar Metals Limited Email: ... Phone: +1 844-753-0045 |
Neither TSX Venture Exchange nor its Regulation Services Provider (as that term is defined in the policies of the TSX Venture Exchange) accepts responsibility for the adequacy or accuracy of this release.
Cautionary Statement Regarding Forward-Looking Information
This news release contains "forward-looking statements" and "forward-looking information" (together, "forward-looking statements") within the meaning of applicable Canadian securities laws and the United States Private Securities Litigation Reform Act of 1995. All statements, other than statements of historical fact, are forward-looking statements and are based on the opinions and estimates of management as of the date hereof. Forward-looking statements in this release include, but are not limited to: the economic potential or projections of the PFS, including, but not limited to, estimates of capital and operating costs, mine life, throughput, grades, recoveries, production rates, payback period, NPV and IRR; statements regarding expected timing, scope and cost of planned exploration, drilling, metallurgical and engineering programs, or any future work or social programs generally; the anticipated timing of completion of a Feasibility Study; expectations concerning permitting, submission and approval of amendment applications; the timing and potential development of an underground decline or early-works program; the potential for additional mineralization at depth and future exploration success or improvements in resource classification; the availability of the PFS within the prescribed deadline, the Company's plans regarding financing arrangements, including the potential for a project finance facility; the expectation that cash flow from existing operations may fund future development; projections of future metal prices; the potential for Cerro Del Gallo to be placed into production and the timing thereof; and other statements regarding the Company's future plans, strategies, objectives, expectations and intentions.
Forward-looking statements are based on a number of assumptions considered reasonable by management at the time of making such statements, including, without limitation: the accuracy of the PEA assumptions and parameters; that required permits and approvals will be obtained on reasonable terms and within expected timeframes; the availability of financing for exploration and development activities on acceptable terms; that projected metallurgical recoveries and operating costs will be achieved; that community and governmental support for operations will continue; the reliability of certain assumptions and known risks; and general stability in economic and market conditions, exchange rates and commodity prices.
Forward-looking statements are subject to known and unknown risks, uncertainties and other factors that may cause actual results to differ materially from those expressed or implied. Such risks include, without limitation: the preliminary nature of the PFS; risks related to exploration, development, permitting and operating activities; cost escalation and inflation; geopolitical or economic uncertainty or force majeure events; changes in metal prices and exchange rates; financing and liquidity risks; community and environmental risks; reliance on contractors and third parties; title, tax and legal risks; and those risks set out in the Company's continuous disclosure filings available on SEDAR+ ( ).
There can be no assurance that the Cerro del Gallo Project will be developed into a producing mine or that the results of the PFS will be realized. The purpose of the forward-looking statements is to provide information about management's current expectations and plans and may not be appropriate for other purposes. Readers are cautioned not to place undue reliance on forward-looking statements, which speak only as of the date of this release. Except as required by applicable securities laws, the Company does not undertake to update any forward-looking statements, whether as a result of new information, future events or otherwise.
No Production Decision: The Company cautions that it has not made a production decision with respect to the Cerro del Gallo Project. Any such decision would only be made following completion of a Feasibility Study, the arrangement of project financing, and receipt of all necessary permits and approvals.
Cautionary Note to U.S. Investors
Mineral Resources that are not Mineral Reserves do not have demonstrated economic viability, and U.S. investors are cautioned that terms such as "Measured," "Indicated" and "Inferred Mineral Resource" are recognized and required by Canadian regulations but may not be comparable to similar terms used in U.S. reporting standards.
Non-IFRS Financial Measures
This news release includes certain non-International Financial Reporting Standards ("IFRS") performance measures, including cash costs ("Cash Costs") and all-in sustaining costs ("AISC"). These measures are not standardized financial measures under IFRS and may not be comparable to similar measures used by other issuers. They are provided as additional information to investors and should not be considered in isolation or as a substitute for measures prepared in accordance with IFRS. Cash Costs and AISC are common financial performance measures in the gold mining industry but do not have any standardized meaning under IFRS. The Company believes that, in addition to conventional measures prepared in accordance with IFRS, certain investors use these metrics to evaluate the economic performance of mining projects and their potential to generate operating earnings and cash flow.
AISC is calculated in accordance with the guidelines published by the World Gold Council ("WGC") in 2013, as updated in 2018, which define AISC as the sum of total cash costs, sustaining capital expenditures, and corporate general and administrative costs, among other items. Other companies may calculate this measure differently due to variations in underlying principles and policies applied. Note that in respect of AISC metrics disclosed herein, corporate general and administrative expenses have not been included, as such economics are presented at the project level.
![]()
To view the source version of this press release, please visit
SOURCE: Heliostar Metals Ltd.

Legal Disclaimer:
MENAFN provides the
information “as is” without warranty of any kind. We do not accept
any responsibility or liability for the accuracy, content, images,
videos, licenses, completeness, legality, or reliability of the information
contained in this article. If you have any complaints or copyright
issues related to this article, kindly contact the provider above.
Most popular stories
Market Research


Comments
No comment