


403
Sorry!!
Error! We're sorry, but the page you were looking for doesn't exist.
PRGR Portable Launch Monitor Market Size To Surpass USD 364.80 Million By 2033 Report By SNS Insider
| Report Attributes | Details |
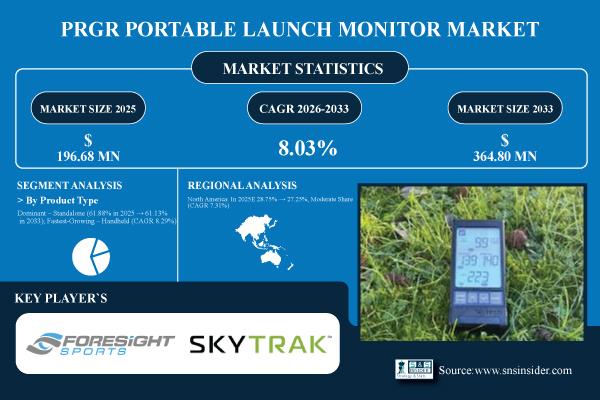
| Market Size in 2025 | USD 196.68 Million |
| Market Size by 2033 | USD 364.80 Million |
| CAGR | CAGR of 8.03% From 2026 to 2033 |
| Report Scope & Coverage | Market Size, Segments Analysis, Competitive Landscape, Regional Analysis, DROC & SWOT Analysis, Forecast Outlook |
| Key Segmentation | . By Product Type (Handheld and Standalone) . By Application (Golf Training, Sports Analytics, Personal Use and Professional Use) . By Distribution Channel (Online Stores, Specialty Sports Stores and Retail Stores) . By End User (Amateur Golfers, Professional Golfers and Coaches &Trainers) |
Purchase Single User PDF of PRGR Portable Launch Monitor Market Report (20% Discount) @
Key Industry Segmentation
By Product
The PRGR Portable Launch Monitor market is dominated by standalone devices holding a 61.88% share in 2025, which remain the preferred choice for most users due to their comprehensive features and accuracy. Handheld models are experiencing the fastest growth at CAGR of 8.29%, driven by demand for portability, ease of use, and convenience, making them increasingly popular among casual and on-the-go golfers.
By Application
Personal use remains the dominant application with a share of 31.50% in the PRGR Portable Launch Monitor market, driven by golfers seeking convenient home practice, individual training, and skill improvement. Sports analytics is the fastest-growing application at a CAGR of 8.84%, fueled by increasing demand for data-driven performance insights, advanced swing analysis, and integration with simulation and coaching software.
By Distribution Channel
Online Stores leads the market with a share of 43.25% in 2025 due to their convenience, wide product selection, and competitive pricing. They are also the fastest-growing channel, as consumers increasingly prefer e-commerce platforms for purchasing launch monitors, accessing updates, and buying related accessories.
By End-User
Amateur Golfers segment holds the largest share of 43.12% in 2025 due to widespread adoption among casual players for practice and personal improvement. This segment is also the fastest-growing, supported by the increasing popularity of portable, user-friendly launch monitors that provide accurate data, immersive simulations, and training flexibility for non-professional players.
Regional Insights:
North America dominates the PRGR Portable Launch Monitor Market holding a share of 28.75% in 2025E, driven by widespread adoption of advanced golf technologies, strong consumer spending on sports equipment, and the presence of key market players.
Asia Pacific is the fastest-growing region in the PRGR Portable Launch Monitor market at a CAGR of 9.53%, fueled by rising golf popularity, expanding middle-class consumer spending, increasing adoption of smart sports technologies, and growing awareness of performance-tracking devices.
Do y ou h ave a ny s pecific q ueries o r n eed a ny c ustomiz ed r esearch on PRGR Portable Launch Monitor Market ? Submit your inquiry here @
Recent News:
- In July 2024, SkyTrak released its major Version 5.0 software update, introducing SkyTrak Course Play with iconic courses like Pebble Beach and Quail Hollow, plus five new Practice Ranges. In January 2025, At the 2025 PGA Show, Rapsodo showcased updates to its MLM2PRO Mobile Launch Monitor, including enhanced graphics on 30,000+ courses, Target Range, and junior tees for family play.
Exclusive Sections of the PRGR Portable Launch Monitor Market Report (The USPs):
- TECHNOLOGICAL ADOPTION RATE – helps you assess innovation momentum by tracking accuracy levels for ball speed/launch angle, response time improvements, adoption of radar and sensor-fusion technologies, mobile/cloud connectivity integration, and patent activity shaping next-gen portable launch monitors. PERFORMANCE & RELIABILITY INDEX – helps you evaluate product quality through metrics such as detection consistency across club types, MTBF, environmental durability, battery performance, and drop/shock resistance standards. MANUFACTURING CAPACITY & QUALITY METRICS – helps you understand supply robustness using indicators such as production capacity utilization, assembly yield rates, defect rates in final units, manufacturing cycle times, and the extent of localized component sourcing. COST STRUCTURE & PRICING ANALYSIS – helps you interpret market competitiveness with insights into ASP variations by model, detailed cost breakdowns (sensors, electronics, casing, assembly), technology-driven price trends, OEM vs retail pricing gaps, and total cost of ownership for users. SUPPLY CHAIN & COMPONENT DEPENDENCY INDEX – helps you identify procurement risks and opportunities by analyzing reliance on key sensor components, sourcing concentration, and the influence of radar/electronic module availability on pricing and production timelines.
About Us:
SNS Insider is one of the leading market research and consulting agencies that dominates the market research industry globally. Our company's aim is to give clients the knowledge they require in order to function in changing circumstances. In order to give you current, accurate market data, consumer insights, and opinions so that you can make decisions with confidence, we employ a variety of techniques, including surveys, video talks, and focus groups around the world.
CONTACT: Contact Us: Rohan Jadhav - Principal Consultant Phone: +1-315 636 4242 (US) | +44- 20 3290 5010 (UK)
Legal Disclaimer:
MENAFN provides the
information “as is” without warranty of any kind. We do not accept
any responsibility or liability for the accuracy, content, images,
videos, licenses, completeness, legality, or reliability of the information
contained in this article. If you have any complaints or copyright
issues related to this article, kindly contact the provider above.
Most popular stories
Market Research

More Story


Comments
No comment