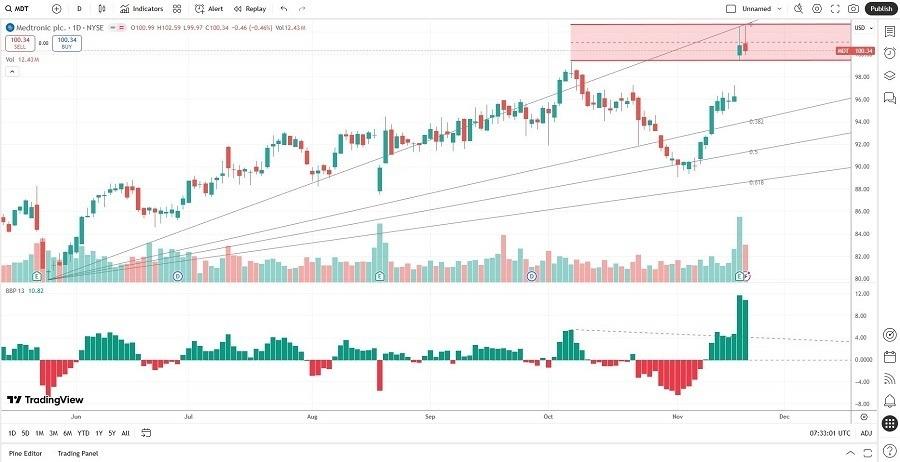
(MENAFN- Daily Forex) A strong earnings report led to a post-earnings spike, despite muted revenue guidance and declining profit margins. Should you sell the price spike?Short Trade IdeaEnter your short position between 99.41 (the intra-day low on the day of its earnings release) and 102.59 (yesterday's intra-day high).Market Index Analysis Medtronic (MDT) is a member of the S&P 100 and the S&P 500. Both indices are in a bearish chart pattern, with rising downside pressure The Bull Bear Power Indicator for the S&P 500 is bearish with a descending trendline and does not confirm the uptrend
Market Sentiment AnalysisEquity markets finished yesterday's session higher, and equity futures are surging on the back of NVIDIA's earnings reports and guidance. It suggests the AI trend is strong, and all eyes are on September's delayed NFP report, expected to show modest job gains. Minutes from the Federal Reserve's last meeting highlighted different views on future monetary policy. Walmart will report earnings before the bell, offering more data on consumer health following mixed reports from other retailers Fundamental AnalysisMedtronic is a medical device company that develops and manufactures innovative technologies and therapies. Its core segments are cardiovascular, medical surgical, neuroscience, and diabetes. It operates in over 150 countries and employs more than 90,000 people.So, why am I bearish on MDT following its post-earnings spike?Medtronic reported a beat in revenues and earnings per share, $8.96 billion and $1.36, respectively. MDT reported the strongest cardiovascular revenue growth rate in over a decade, but profit margins are slipping, and the debt-to-asset ratio is rising. I remain bearish on the regulatory landscape and the mediocre outlook that trails the industry average. The PEG ratio also suggests that a company remains overvalued.Medtronic Fundamental Analysis Snapshot
| Metric | Value | Verdict |
| P/E Ratio | 27.19 | Bearish |
| P/B Ratio | 2.70 | Bearish |
| PEG Ratio | 4.86 | Bearish |
| Current Ratio | 2.01 | Bullish |
| ROIC-WACC Ratio | Positive | Bullish The price-to-earnings (P/E) ratio of 27.19 indicates MDT is fairly valued. By comparison, the P/E ratio for the S&P 500 is 29.87.The average analyst price target for MDT is 109.43. It suggests modest upside potential with heightened downside risks Technical AnalysisToday's MDT Signal The MDT D1 chart shows price action inside a horizontal resistance zone It also shows price action trading between its ascending 0.0% and 38.2% Fibonacci Retracement Fan The Bull Bear Power Indicator is bullish, but shows upward exhaustion The average bullish trading volumes are higher than the average bearish trading volumes, but bearish volumes began to rise MDT surged with the S&P 500 drifting lower, a bullish development, but reversal signs have started to show My CallI am taking a short position in MDT between 99.41 and 102.59. Medtronic has excellent long-term potential with its pulsed field ablation (PFA) technology. Still, I remain bearish in the medium term, given rising debt, shrinking profit margins, and a meager outlook. MDT Entry Level: Between 99.41 and 102.59 MDT Take Profit: Between 79.93 and 83.63 MDT Stop Loss: Between 107.24 and 109.43 Risk/Reward Ratio: 2.49 Ready to trade our analysis of Medtronic? Here is our list of the best stock brokers worth checking out. |
MENAFN20112025000131011023ID1110375314
Legal Disclaimer:
MENAFN provides the
information “as is” without warranty of any kind. We do not accept
any responsibility or liability for the accuracy, content, images,
videos, licenses, completeness, legality, or reliability of the information
contained in this article. If you have any complaints or copyright
issues related to this article, kindly contact the provider above.


Comments
No comment