BTC/USD Forex Signal 29/09: Weakly Bullish (Chart)
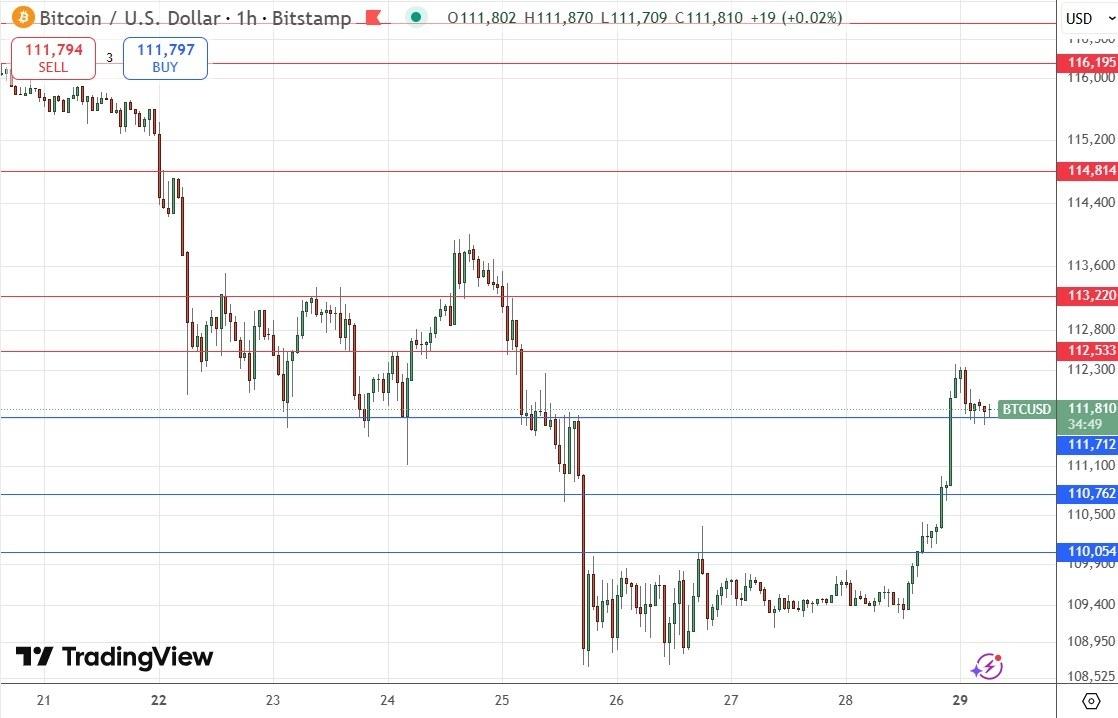
(MENAFN- Daily Forex) My previous BTC/USD signal last Thursday may have produced a losing long trade from the initial rejection of $110,762. Today's BTC/USD SignalsRisk 0.50% per trade.Trades must be entered before 5pm Tokyo time Tuesday Trade Ideas
- Long entry after a bullish price action reversal on the H1 timeframe following the next touch of $111,712, $110,762, or $110,054. Place the stop loss $100 below the local swing low. Adjust the stop loss to break even once the trade is $100 in profit by price. Remove 50% of the position as profit when the trade is $100 in profit by price and leave the remainder of the position to ride.
- Short entry after a bullish price action reversal on the H1 timeframe following the next touch of $112,533, $113,220, or $114,814. Place the stop loss $100 above the local swing high. Adjust the stop loss to break even once the trade is $100 in profit by price. Remove 50% of the position as profit when the trade is $100 in profit by price and leave the remainder of the position to ride.
Failures and bearish reversals at $112,533 or $113,220 could make good short trades for swing traders.
EURUSD Chart by TradingViewThere is nothing of high importance due today regarding either Bitcoin or the US Dollar.Ready to trade our daily Forex signals? Here is our list of MT4 crypto brokers worth reviewing.
Legal Disclaimer:
MENAFN provides the
information “as is” without warranty of any kind. We do not accept
any responsibility or liability for the accuracy, content, images,
videos, licenses, completeness, legality, or reliability of the information
contained in this article. If you have any complaints or copyright
issues related to this article, kindly contact the provider above.
Most popular stories
Market Research

- Seoul Exchange, One Of Only Two Licensed Platforms For Unlisted Securities, Will Exclusively Use Story To Settle Tokenized Rwas
- Phase 6 Reaches 50% Mark As Mutuum Finance (MUTM) Approaches Next Price Step
- 0G Labs Launches Aristotle Mainnet With Largest Day-One Ecosystem For Decentralized AI
- Solotto Launches As Solana's First-Ever Community-Powered On-Chain Lottery
- Kintsu Launches Shype On Hyperliquid
- Blockchainfx Raises $7.24M In Presale As First Multi-Asset Super App Connecting Crypto, Stocks, And Forex Goes Live In Beta


Comments
No comment