Key Technical Levels To Watch For Asian, European And US Stock Indices Amid Middle East Turmoil
On June 13, 2025, Israel initiated a significant military operation, "Operation Rising Lion," targeting Iran's nuclear and military infrastructure, resulting in the deaths of key Iranian military leaders. In retaliation, Iran launched over 100 drones towards Israel, all of which have apparently been shot down, escalating regional tensions and prompting widespread airspace closures in the region.
This escalation has led to substantial market volatility: Brent crude oil prices initially surged over 12%, exceeding $77.00 per barrel, due to fears of supply disruptions through the Strait of Hormuz.
The gold price also spiked to a near two-month high at $3,444.50 per troy ounce, as investors sought safe-haven assets amid the uncertainty.
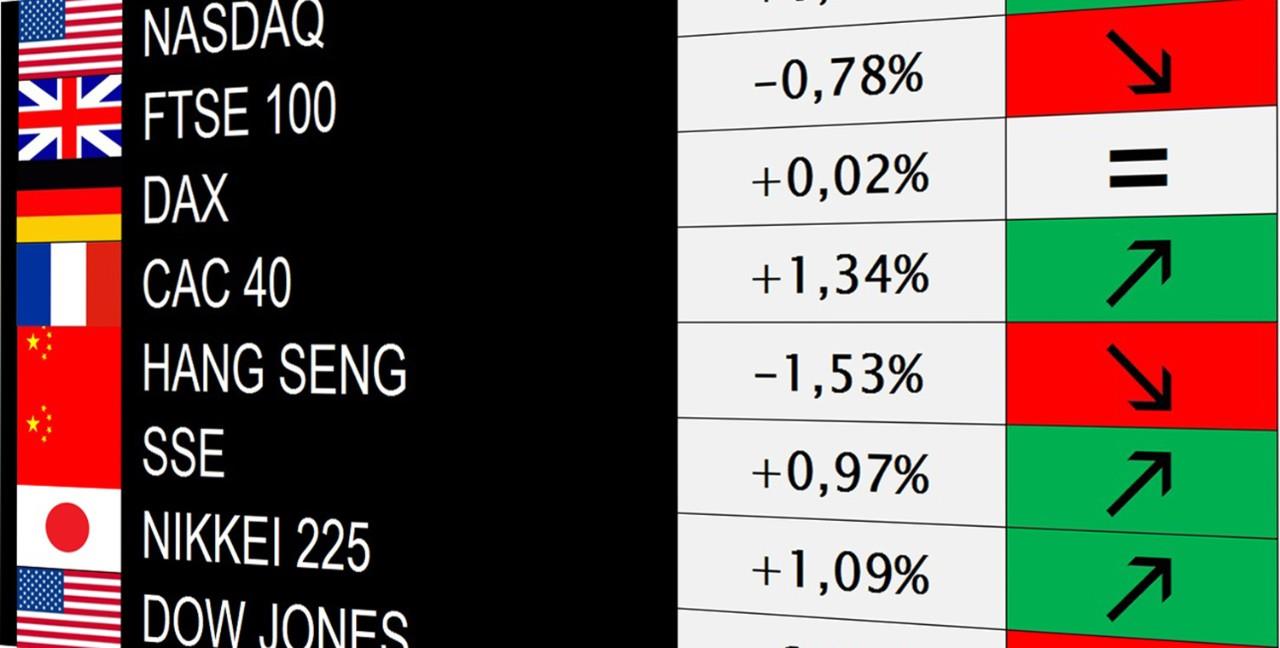
Global stock markets reacted negatively, with significant declines across major indices.
Key technical levels to watch on European and Asian stock indicesThe 23 May low technically is the line in the sand for major global stock indices as a daily chart close below these lows could trigger a deeper correction in the past few months strong bull market.
So far, only the German DAX 40 futures index hit this level in pre-market trading before bouncing off it. The DAX 40 cash index is currently testing and trying to bounce off its major 23,476-to-23,275 support zone which consists of the early March highs and late May lows. While it holds, the medium-term uptrend is deemed to be intact.
DAX 40 daily candlestick chart Source: TradingViewThe FTSE 100 seems to be little perturbed as it remains within a clearly defined and gradual uptrend, staying on track to reach its March record high at 8,909 while targeting the 9,000 region.
The 23 May low lies a long way away at the 23 May low at 8,601. While trading above this level, the medium-term uptrend remains bullish.
FTSE 100 daily candlestick chart Source: TradingViewThe Nikkei 225 has taken more of a hit and slipped back below its 200-day simple moving average (SMA) at 37,915. As long as the 22 May low at 36,856 underpins, further sideways trading remains on the cards.
For a bullish trend continuation to be witnessed, Wednesday's near 5-month high at 38,529 will need to be exceeded on a daily chart closing basis. In that case the mid-February peak at 39,581 would be next in line.
Nikkei 225 daily candlestick chart Source: TradingView Key technical levels to watch on US stock indicesThe Nasdaq 100 has fallen through its April-to-June steep uptrend line and may see several days of correction unfold as negative divergence remains in play between Wednesday's multi-months high at 22,041 and the daily Relative Strength Index (RSI).
The index is still a long way away, around 5%, from its May 23 low at 20,778. Only if it were to be slipped through, would the recent bull run come into question.
Nasdaq 100 daily candlestick chart Source: TradingViewThe technical situation looks very similar for the S&P 500 , its daily candlestick chart also displaying negative divergence on the daily RSI and having slipped through its April-to-June uptrend line.
The 200-day SMA and 23 May low at 5,804-to-5,768 are the lines in the sand for the bulls. Provided that they hold, the medium-term uptrend remains intact.
S&P 500 daily candlestick chart Source: TradingView
Legal Disclaimer:
MENAFN provides the
information “as is” without warranty of any kind. We do not accept
any responsibility or liability for the accuracy, content, images,
videos, licenses, completeness, legality, or reliability of the information
contained in this article. If you have any complaints or copyright
issues related to this article, kindly contact the provider above.
Most popular stories
Market Research

- The Dubai Insiders Club Expands Access To Australia And Asia Amid Surge In International Investor Demand
- From Zero To Crypto Hero In 25 Minutes: Changelly Introduces A Free Gamified Crash Course
- Lowkick Studio Launches $SHARDS Token On Top Tier Exchanges For Worldshards MMORPG
- TOKEN2049 Singapore Breaks Records: 25,000 Attendees At The World's Largest Web3 Event
- Red Lions Capital And Neovision Launch DIP.Market Following ADGM Regulatory Notification
- USDT0 And Xaut0 Are Now Live On Polygon


Comments
No comment