403
Sorry!!
Error! We're sorry, but the page you were looking for doesn't exist.
BTC/USD Signal Today 26/03: Rising Wedge Warning (Chart)
(MENAFN- Daily Forex) Bearish view
- Sell the BTC/USD pair and set a take-profit at 84,000. Add a stop-loss at 94,000. Timeline: 1-2 days.
- Buy the BTC/USD pair and set a take-profit at 94,000. Add a stop-loss at 84,000.
The BTC/USD pair also rose as signs of demand from the United States rose. Data by SoSoValue shows that Bitcoin ETFs have had inflows in the past seven days. They now have over $36 billion in cumulative inflows, bringing the total net assets to $99.1 billion.
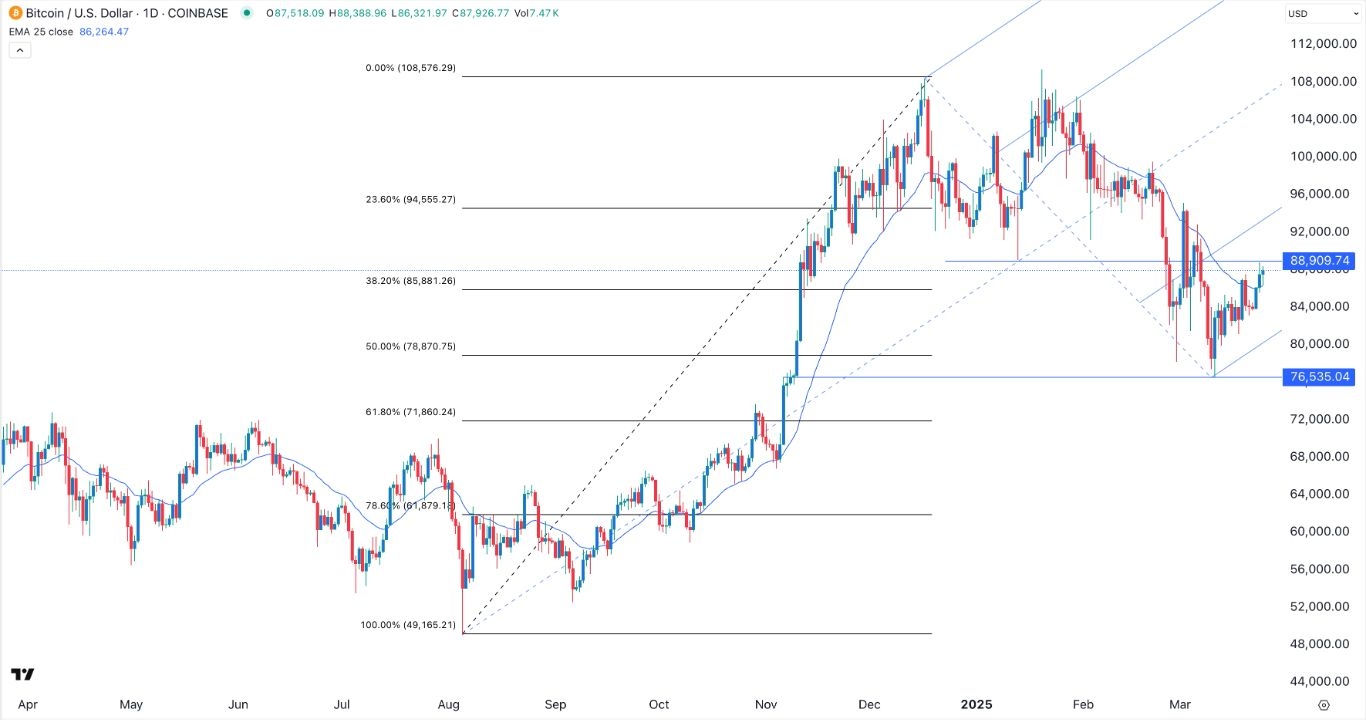
EURUSD Chart by TradingViewBTC/USD technical analysisThe daily chart shows that the BTC/USD pair bounced back after hitting a low of 76,535 earlier this month. It has remained between the lower and first support lines of the Andrew's Pitchfork tool.The BTC/USD pair has moved slightly above the 38.2% Fibonacci Retracement level at 85,880 and the 50-day Exponential Moving Average (EMA). That is a sign that bulls are in control for now.However, the coin has formed a rising wedge pattern and retested the key resistance level at 88,910, the neckline of the double-top pattern at 108,575. A rising wedge is a popular bearish reversal pattern.Therefore, the pair will likely retreat and retest the key support level at 80,000 in the coming days. A move above the resistance at 94,555 will invalidate the bearish view.Ready to trade our free trading signals ? We've made a list of the best Forex crypto brokers worth trading with.
Legal Disclaimer:
MENAFN provides the
information “as is” without warranty of any kind. We do not accept
any responsibility or liability for the accuracy, content, images,
videos, licenses, completeness, legality, or reliability of the information
contained in this article. If you have any complaints or copyright
issues related to this article, kindly contact the provider above.


Comments
No comment