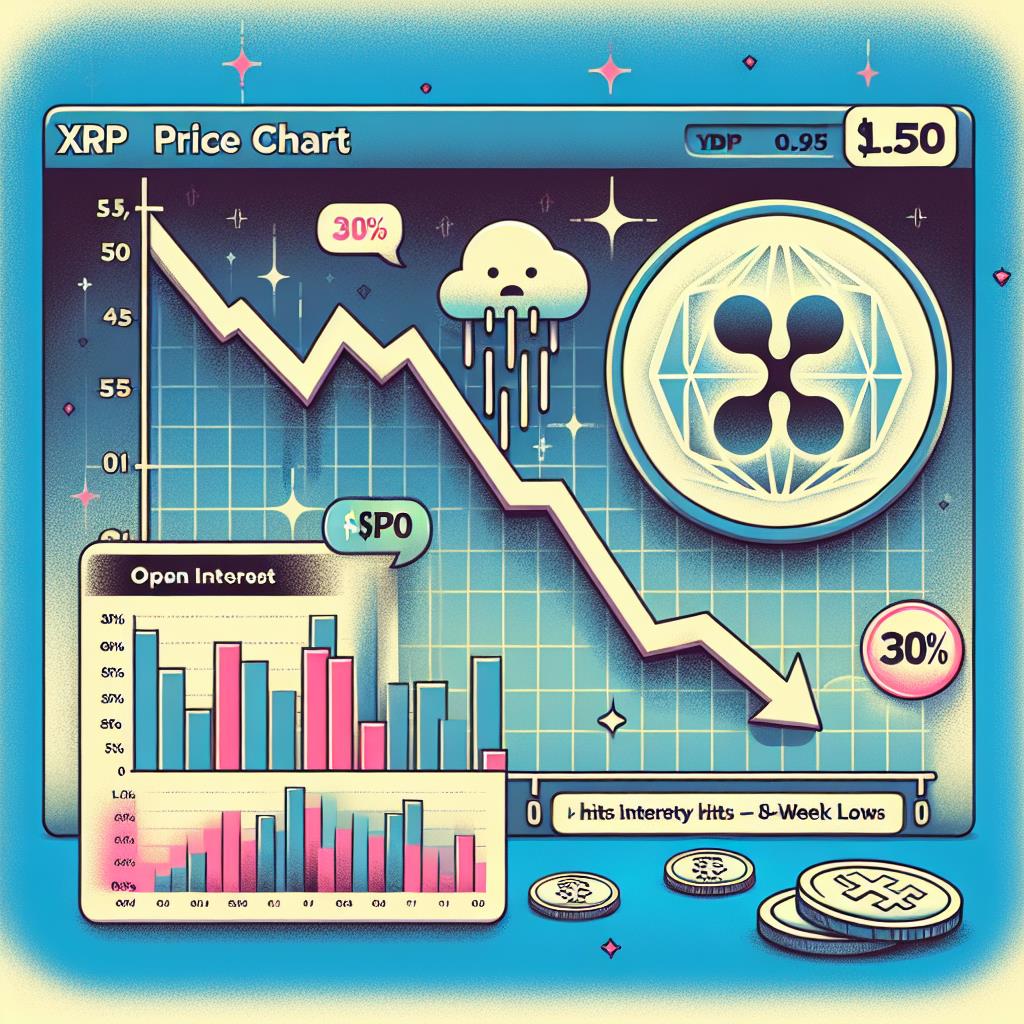
XRP Price Chart Predicting 30% Drop To $1.50 As Open Interest Hits 8-Week Lows
Technical analysis of the XRP price chart indicates that a downward trend is likely to continue, with a target of $1.50. This level has been a key support and resistance area in the past, making it an important price point to watch.
It is crucial for traders to have a solid risk management strategy in place when trading XRP or any other cryptocurrency. Volatility in the market can lead to rapid price movements, so it is important to stay up to date with the latest news and market analysis.
Overall, the XRP market is facing a period of uncertainty, and traders should proceed with caution. By carefully monitoring the price chart and open interest levels, investors can make more informed decisions about their trading strategies. Stay informed and be prepared for potential price drops in the near future.
Crypto Investing Risk WarningCrypto assets are highly volatile. Your capital is at risk.
Don't invest unless you're prepared to lose all the money you invest.
This is a high-risk investment, and you should not expect to be protected if something goes wrong.
Legal Disclaimer:
MENAFN provides the information “as is” without warranty of any kind. We do not accept any responsibility or liability for the accuracy, content, images, videos, licenses, completeness, legality, or reliability of the information contained in this article. If you have any complaints or copyright issues related to this article, kindly contact the provider above.


Comments
No comment