


Growth In Water Consumption Of Data Centres Needs More Attention
(MENAFN- ING) While energy efficiency and greenhouse gas emissions have become mainstream in the
sustainability strategies of
data centres, water management is an area
that needs more attention In this article Water consumption by big tech firms has surged Managing water usage More work needed
In order to continue using water to cool data centres, companies now need to enhance water usage efficiency, work with local communities and minimise the risk from droughts Water consumption by big tech firms has surged
WSJ Water consumption by Microsoft, Google and Meta in billion litres per year
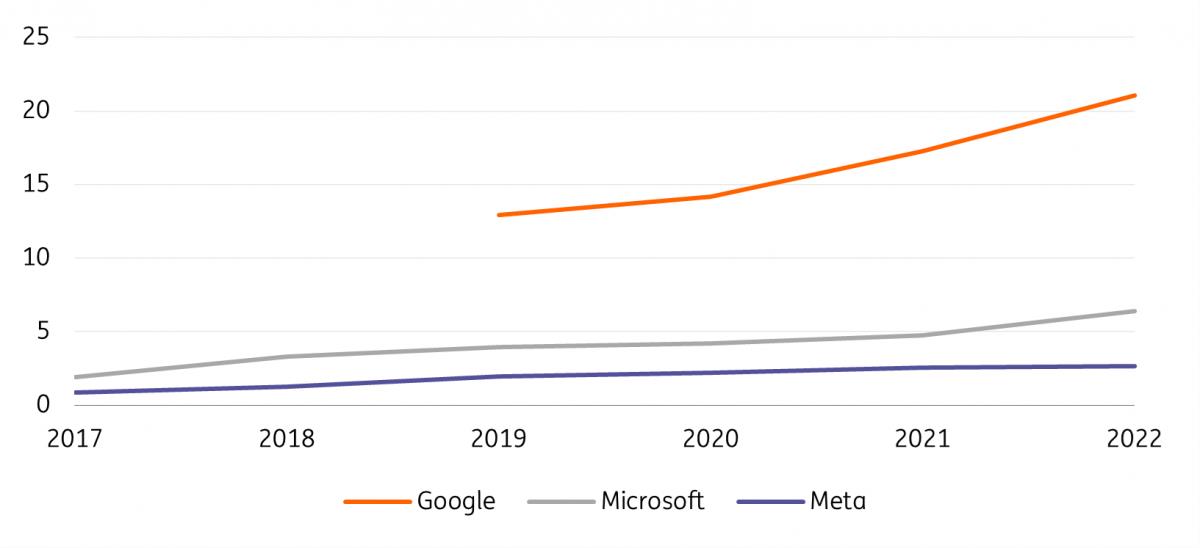
ING Research based on company reporting (Note: Water consumption = water withdrawal – water discharge) Managing water usage
ING Research based on company reporting More work needed
sustainability strategies of
data centres, water management is an area
that needs more attention In this article Water consumption by big tech firms has surged Managing water usage More work needed
In order to continue using water to cool data centres, companies now need to enhance water usage efficiency, work with local communities and minimise the risk from droughts Water consumption by big tech firms has surged
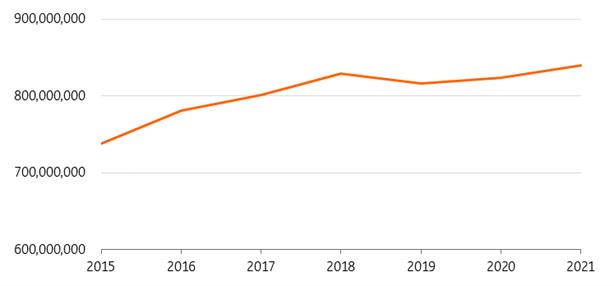
Some data centres can use water for the cooling of their suites that house the cabinets and racks. With the increase in servers, water consumption from data centres has risen significantly worldwide from 738 million litres in 2015 to more than 840 million litres in 2021, as can be seen in the graphs below. This is largely driven by the rising water usage by big technology companies. In the US, which has about 25% of the data centres globally, a mid-sized data centre uses about 300,000 gallons of water a day, equal to the water consumption of 100,000 homes.
Water consumption of data centres globally in litres per dayWSJ Water consumption by Microsoft, Google and Meta in billion litres per year
ING Research based on company reporting (Note: Water consumption = water withdrawal – water discharge) Managing water usage
The challenges data centres face around water usage are often related to their geographical location. Data centres are sometimes in areas where water sources are scarce. For instance, in 2022, 23% of Microsoft's and 18% of Google's freshwater withdrawals were from water stress areas. This means that to continue using water to cool data centres, companies need to enhance water usage efficiency and minimise the risk from droughts. They must also properly manage relationships with the local community for large amounts of water consumption.
Companies like Microsoft and Google have been working on water replenishment through projects such as water conservation to offset their consumption. Microsoft plans to be 'water positive' by 2030 by reducing water consumption, replenishing more than it uses, providing people with access to water and sanitation services, and engaging in water policy. But there is a long way to go to replenish more than one consumes. Google is one of the only companies to have reported that it replenished 6% of its freshwater consumption in 2022. There are more nuances to this. If a company consumes less water than it replenishes at the global level, it could still worsen water stress situations in a specific region while replenishing water elsewhere.
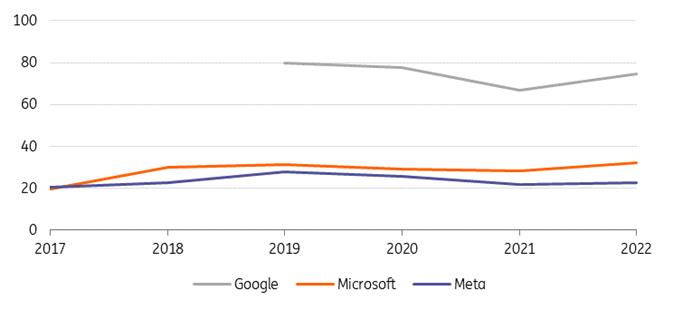
Other practices include water recycling, cooling system upgrading, and research & development to bring innovative technologies into use. Although more data centres and technology companies are actively managing water usage, reporting on water usage is not as widespread as reporting on power consumption or energy efficiency. Companies need to up their game. In addition to absolute usage, there is limited disclosure of relative water consumption metrics (some metrics can be calculated from other disclosed data). The first is Water Usage Efficiency (WUE). Similar to PUE, WUE is the ratio between annual data centre water usage and the energy use (kWh) of ICT equipment. The second metric is water consumption as a ratio of company revenue. For big technology companies, this ratio has more or less stayed stable over the past few years. This possibly indicates that there is room for improvement for more efficient water management.
Water consumption intensity by Microsoft, Google and Meta in cubic meters per $million of revenueING Research based on company reporting More work needed
These metrics would allow for better comparisons among peers. Some investors are becoming interested in looking at water and water intensity-related metrics when considering sustainable finance products. In a nutshell, water usage is attracting attention from the data centre industry, but a lot more effort is needed to bring net water usage down and report on progress.
Author:Coco Zhang, Jan Frederik Slijkerman, Diederik Stadig

Legal Disclaimer:
MENAFN provides the
information “as is” without warranty of any kind. We do not accept
any responsibility or liability for the accuracy, content, images,
videos, licenses, completeness, legality, or reliability of the information
contained in this article. If you have any complaints or copyright
issues related to this article, kindly contact the provider above.
Most popular stories
Market Research

- Poppy Seed Market Size, Share, In-Depth Insights, Opportunity And Forecast 2025-2033
- The Dubai Insiders Club Expands Access To Australia And Asia Amid Surge In International Investor Demand
- What Are The Latest Trends In The Europe Steel Market For 2025?
- UK Digital Health Market To Reach USD 37.6 Billion By 2033
- Nowpayments To Participate In Sigma Europe Rome 2025
- Japan Skin Care Products Market Size Worth USD 11.6 Billion By 2033 CAGR: 4.18%
More Story


Comments
No comment